Supersized: Americans Are Living in Bigger Houses With Fewer People


Your dream home deserves the perfect insurance plan. Find the best policy for you by comparing quotes.
For many people, part of the American Dream involves becoming a homeowner. We all want a place to call our own, and for many Americans, that ideal place includes multiple bedrooms and a sprawling yard. The growth of U.S. home sizes seems to reflect this trend.
Although the size of the average American home has grown bigger and bigger, household sizes have actually decreased. That means most of us are living large with fewer people. These trends often result from demographic shifts and societal factors.
We analyzed data from the U.S. Census Bureau to visualize just how much homes have grown in size since the 1970s. To find out how much home you could buy in different cities, we used data from Zillow to find out the most affordable and most expensive areas.
Here’s what we found:
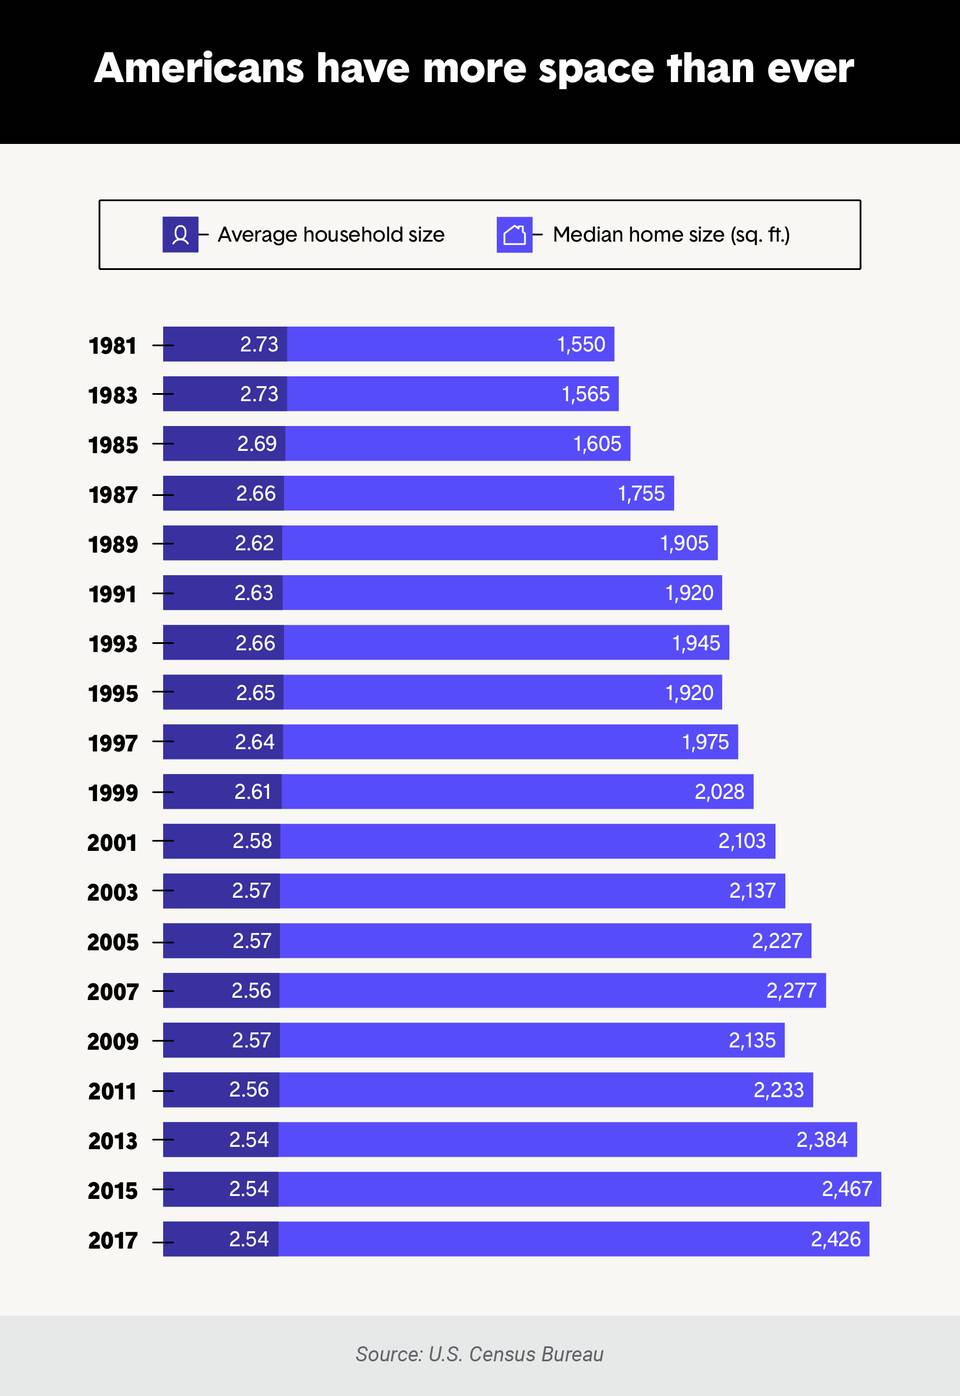
- The median home size for newly constructed houses has increased by 150% since 1980.
- While houses are getting larger, the median household size has decreased by 16% since 1940.
- The median home sales price in 2019 was $239,900.
- Of the 10 largest cities in the U.S., Houston and Atlanta get you the most house for your dollar. Unsurprisingly, New York and Los Angeles were the most expensive per square foot.
Median home sizes have grown by 150% since 1980
In 1980, the median size of a new home in the U.S. was 1,595 square feet. Nearly 40 years later, the median size of newly constructed homes was 2,386 square feet (2018). Most of the newly constructed homes in the U.S. boast four or more bedrooms, multiple bathrooms, a patio, and a porch, according to the U.S. Census Bureau. On top of that, houses also come equipped with large kitchens, home office space, and even dedicated rooms for man caves or craft rooms.

Only very recently have home sizes started to shrink. The median home size peaked in 2015 at 2,467 square feet and has slowly declined each year since. Some experts say that smaller available lots and higher construction costs may point to the slight dip in the median new home size. These changes in new home sizes may also reflect the changing demographics of those occupying them.
Houses are getting bigger, but families are getting smaller
You’d expect that household sizes would keep pace with the extra square footage, but the exact opposite is true. Since 1940, the number of people per U.S. household has decreased by 16%. Despite the nation having fewer people per household, home size has generally kept growing.
This change in household size could be attributed to the declining fertility rate as women have fewer children, resulting in smaller families. Other demographic shifts like living separately from elderly parents may have also contributed to the decline.
Feel like you’re forever alone? You’re in the same situation as nearly one-third of Americans. The number of people who lived alone in 1960 was just above 5%. In 2019, that number grew to more than 30%. Some demographers say trends like urbanization and the growing median marriage age may explain the increase in solo living.
The median home price in the U.S. was $239,900 in 2019
The median home sales price for all homes was $239,900, according to the latest data released by Zillow. This number is much lower than the $331,400 median selling price for new homes, according to the latest data from the U.S. Census Bureau. New homes are typically more expensive than older homes, but the median sales price helps researchers understand growth and construction trends in the housing market. Toward the end of 2019, new median home prices fell for three straight months. Experts say this drop could be related to the tight market and a lack of affordable homes, but 2020 may tell a different story.
How much space can you get for the median home price?
Using the median home sales price of $239,900, we calculated how much square footage you could afford in the largest MSAs. MSAs, or metropolitan statistical areas, are geographic designations used to group cities and their surrounding areas together for statistical analysis. MSAs often have a high population density and may even contain multiple cities, such as the Dallas-Fort Worth metro area.
We used Zillow’s data on the median price per square footage for each MSA to total up how much house you can get for the median home price. New York, L.A., and Boston may not be enough elbow room for you, but Houston, Atlanta, and Dallas will get you the most bang for your buck.

A home is a large investment, but many people find homeownership very rewarding. Until you’re ready to settle into a home, renting is a great way to live without the commitment of buying. No matter where you call home, make it your own and protect your things with the right homeowners or renters insurance.
Methodology
The Zebra compiled data from the U.S Census Bureau to calculate median home sizes compared to median household sizes. Data was also used from Zillow to analyze median home values, median listing prices, and median price per square foot in metro areas.
Additional source: Business Insider
Stay in touch and subscribe!
Get advice, insights and tips from our newsletter.