Average miles driven per year in the U.S.

On average, Americans drive 14,263 miles per year according to the Federal Highway Administration.

Author profile picture

Susan Meyer

Senior Editorial Manager

Credentials
  • Licensed Insurance Agent — Property and Casualty

Susan is a licensed insurance agent and has worked as a writer and editor for over 10 years across a number of industries. She has worked at The Zebr…

Author profile picture

Ross Martin

Insurance Writer

Credentials
  • 4+ years in the Insurance Industry

Ross joined The Zebra as a writer and researcher in 2019. He specializes in writing insurance content to help shoppers make informed decisions.

Ross h…

Driving is a central part of the American identity, and the amount of miles Americans drive each year has exploded in the time since the federal government founded the Interstate Highway System in the 1950s. In the past 40 years, the number of miles Americans collectively drive has increased from 1.5 trillion to 3.2 trillion miles: That’s more than twice as much driving with a population only 1.5 times as large. 

The average miles driven per year by Americans has now reached a total of 14,263 miles. This breaks down to an average of nearly 1,200 miles driven per month. That sum would cover almost three round trips between Los Angeles and New York. As a collective, American drivers cover 3.2 trillion miles each year, enough to take nearly 5,000 trips to the moon and back.

Using data from the Federal Highway Administration, we looked at American driving trends and found:

  • California posts the most total miles per year (340 billion), but Wyoming has the highest per capita mileage at 24,000 each year. 
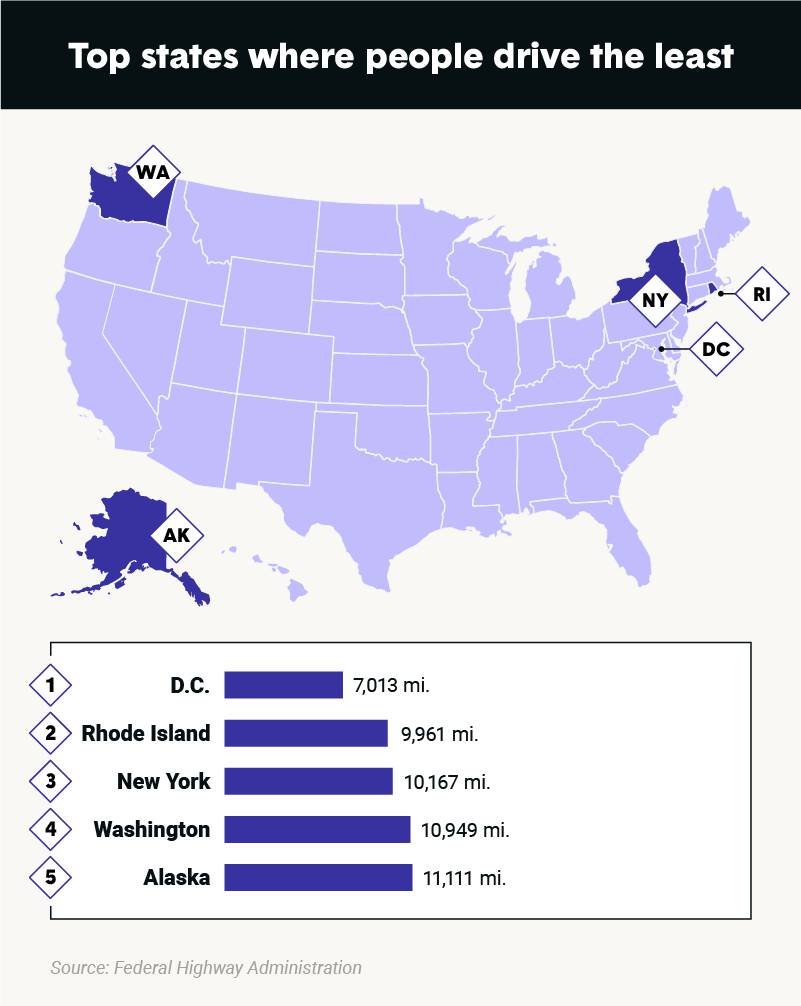
  • Drivers in D.C., Rhode Island, New York, Washington and Alaska drive fewer miles per year than drivers in any other states.
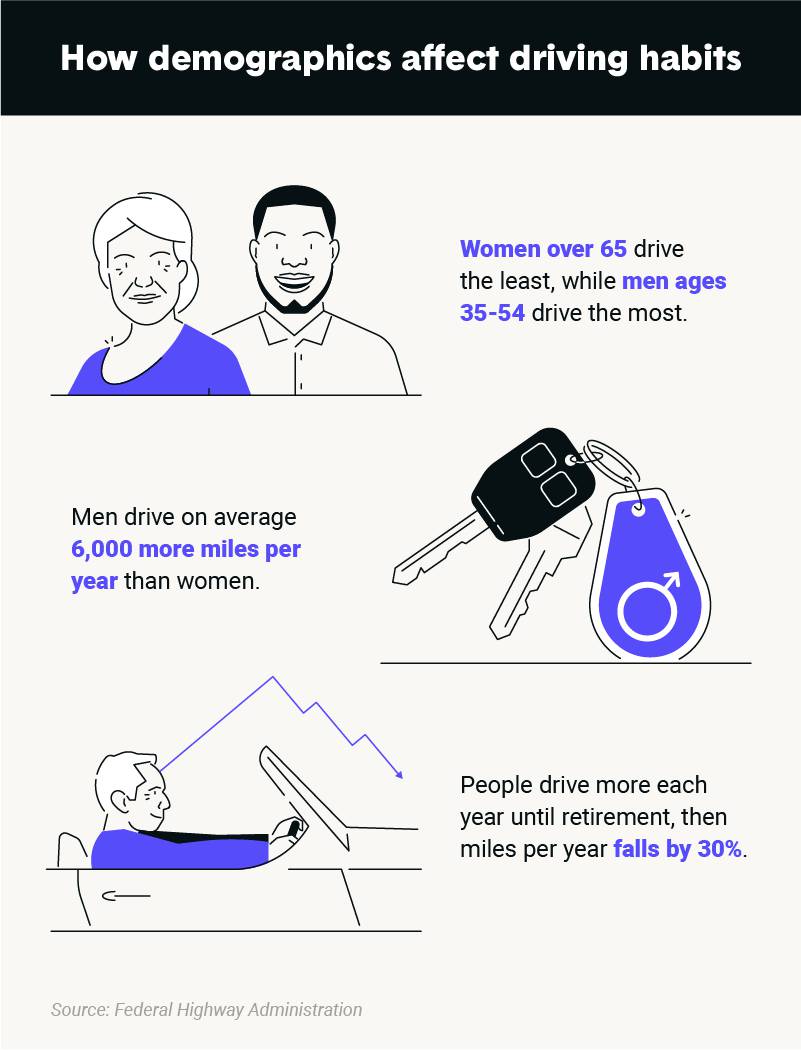
  • Men drive around 6,000 miles per year more than women on average, and after retirement drivers post around 30 percent fewer miles per year. 
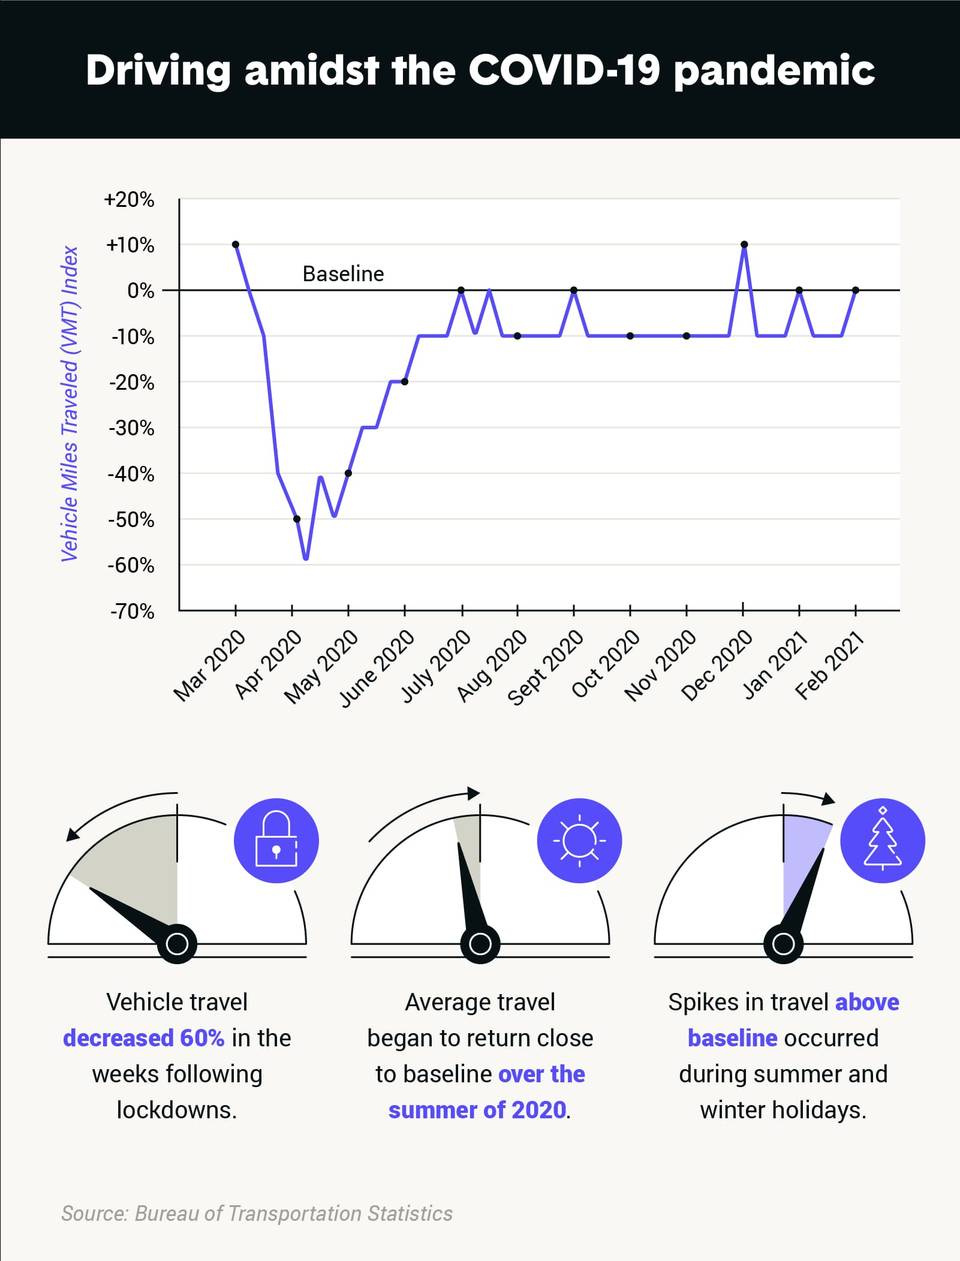
  • During the COVID-19 pandemic, vehicle travel decreased by as much as 60 percent during the initial lockdowns in April 2020.

Since annual mileage is one factor that influences car insurance rates, we wanted to take a deep look at how much Americans drive each year. Read on to see all of our findings or jump ahead to our infographic for an overview.

Average miles driven per year broken down by state

Americans drive a lot, but how much they drive depends a lot on the state where they live. For instance, while populous California accounts for 340 billion miles driven each year — more than any other state — the average driver only covers 12,500 miles annually, less than the nationwide average. On the other hand, Oklahoma posts just 44 billion miles each year (85 percent less than California), but each driver averages 17,700 miles, far more than the average American.

A variety of factors — like fuel costs and density — account for the vast differences between driving habits in each state. Whether you’re cruising around Rhode Island (9,900 miles per year on average) or sailing past Carlsbad Caverns in New Mexico (19,100 miles per year on average), you are a part of a collective of drivers who cover more than 3 trillion miles annually in their cars. 

Below, we have a table with the most recent data from the Federal Highway Administration showing how many miles each state drives in total and per driver.


State Average Miles Per Driver
Alabama 17,817
Alaska 11,111
Arizona 13,090
Arkansas 17,224
California 12,524
Colorado 12,899
Connecticut 12,117
Delaware 12,609
District of Columbia 7,013
Florida 14,557
Georgia 18,334
Hawaii 11,688
Idaho 14,417
Illinois 12,581
Indiana 18,024
Iowa 14,745
Kansas 14,781
Kentucky 16,305
Louisiana 14,951
Maine 14,215
Maryland 13,490
Massachusetts 13,109
Michigan 14,307
Minnesota 17,909
Mississippi 19,966
Missouri 18,521
Montana 15,880
Nebraska 14,846
Nevada 14,016
New Hampshire 11,570
New Jersey 12,263
New Mexico 19,157
New York 10,167
North Carolina 16,073
North Dakota 17,671
Ohio 14,278
Oklahoma 17,699
Oregon 12,218
Pennsylvania 11,445
Rhode Island 9,961
South Carolina 14,941
South Dakota 15,541
Tennessee 15,287
Texas 16,172
Utah 15,516
Vermont 13,004
Virginia 14,509
Washington 10,949
West Virginia 16,876
Wisconsin 15,442
Wyoming 24,069


While it’s interesting to see all of that driving data in one place, it’s even more compelling to look at trends that connect various states together. Read on to see a deep dive into the states where people drive the most and the least.

States where Americans drive the most

Five states from the South and the West top the list of places where Americans drive the most on average. You can check them out below, along with their average miles driven per year.

  1. Wyoming: 24,069 average miles per year
  2. Mississippi: 19,966 average miles per year
  3. New Mexico: 19,157 average miles per year
  4. Missouri: 18,521 average miles per year
  5. Georgia: 18,334 average miles per year

The above states are typically more rural and have less population density than other states. Because of this, these states tend to have fewer options for other methods of transportation, making driving a more convenient way to travel.

 Five-states-where-people-drive-the-most

States where Americans drive the least

The states with the lowest average miles driven per year hail from the East and the broader Pacific Northwest. Below you can find the states that drive the least and their average miles driven per year.

  1. District of Columbia: 7,013 miles
  2. Rhode Island: 9,961 miles
  3. New York: 10,167 miles
  4. Washington: 10,949 miles
  5. Alaska: 11,111 miles

Most of the states with the lowest average miles driven per year boast some of the best public transportation systems in the nation. As the place that Americans drive the least, Washington D.C. is home to one of the largest public transit systems in the country — 25 transit routes are less than half a mile from an average neighborhood block.

Public transportation is often a more affordable and efficient way to travel than by car in these states, so the average number of miles driven is typically lower. Fuel costs can also contribute to whether people drive less on average. Both Washington and Alaska are among the top 10 states with the highest prices for a gallon of regular gas.

 Top-five-states-people-drive-the-least

How demographics affect average miles driven per year

Significant differences in driving behaviors exist among groups according to age and gender, according to the most recent available data from the FHWA. 

Age

It’s no surprise that age tends to influence average driving trends. Older adults who are retired typically don’t have a commute to work, and high school students may have alternate methods of transportation. The data reveals that working-age adults who most likely have to commute to their jobs drive the most miles on average.

  • Young drivers ages 16-19 and adults over 65 drive the least out of all the age groups. Both of these groups drive a similar amount of miles on average — around 7,600 miles a year.
  • Working-age adults drive the most out of all age groups, with the 20-44 age groups driving 15,300 miles on average.


Gender

When it comes to driving, the data reveals that men drive more miles on average than women. These gender differences play out in a number of ways when both age and gender are taken into account. Find some notable differences below.

  • Across all age groups, men drive more than women, though this difference is most pronounced in working-age adults, where men drive 7,500 miles more each year than women.
  • Women over 65 drive the least — just 4,700 miles per year, compared to middle-aged men, who drive the most at 18,800 miles each year.
 effect-of-demographics-on-driving-habits

How does annual mileage affect car insurance?

The annual amount of miles that you drive has an influence on your car insurance rates. If you’re a high mileage driver, your insurance rates tend to go up because there’s a greater risk of you getting into an accident. On the other hand, if you’re a low mileage driver, you may be able to save money on your car insurance.


What do insurance companies consider low mileage?

Although Americans drive an average of 14,263 miles per year, insurance companies generally consider driving 10,000 miles a year or less to be low mileage. Check with your insurer to see what mileage bracket you fall under in order to get a discount on your rates. With most companies, you can find the best discounts if you drive less than 7,000 miles a year.

While many Americans depend on their cars for travel, how much they actually drive depends a lot on age and gender. That said, the recent COVID-19 pandemic has affected driving patterns for the country as a whole, with average miles down significantly.

 How-much-americans-drive-each-year

If you personally have driven less miles in the past year, you might be able to save some money on your car insurance by using telematics with your insurance company. Telematics-powered auto insurance is a form of policy in which insurance companies rely on in-car tracking devices to monitor your driving habits and tendencies. These devices track your vehicle's speed, mileage, total driving time and other factors to help determine the policyholder's car insurance premiums. These usage-based insurance policies usually come with a mobile app to help you easily access real-time data relevant to your rate.

Compare your rates to telematic coverage.

Location pin icon
No junk mail. No spam calls. Free quotes.