The 10 most dangerous roads in the U.S.

Author profile picture

Susan Meyer

Senior Editorial Manager

Credentials
  • Licensed Insurance Agent — Property and Casualty

Susan is a licensed insurance agent and has worked as a writer and editor for over 10 years across a number of industries. She has worked at The Zebr…

Author profile picture

Ross Martin

Insurance Writer

Credentials
  • 4+ years in the Insurance Industry

Ross joined The Zebra as a writer and researcher in 2019. He specializes in writing insurance content to help shoppers make informed decisions.

Ross h…

Table of contents:

Make sure you're protected without overpaying. Compare rates and save today!

Location pin icon
No junk mail. No spam calls. Free quotes.

According to the National Highway Traffic Safety Administration (NHTSA), in 2020 the U.S. had its highest fatality rate since 2007 — reaching 1.37 fatalities per 100 million vehicle miles traveled.

Anytime you get behind the wheel of a vehicle, there’s a chance you might get into a wreck. That said, the likelihood of being in a motor vehicle collision dramatically varies depending on which road you’re driving on.

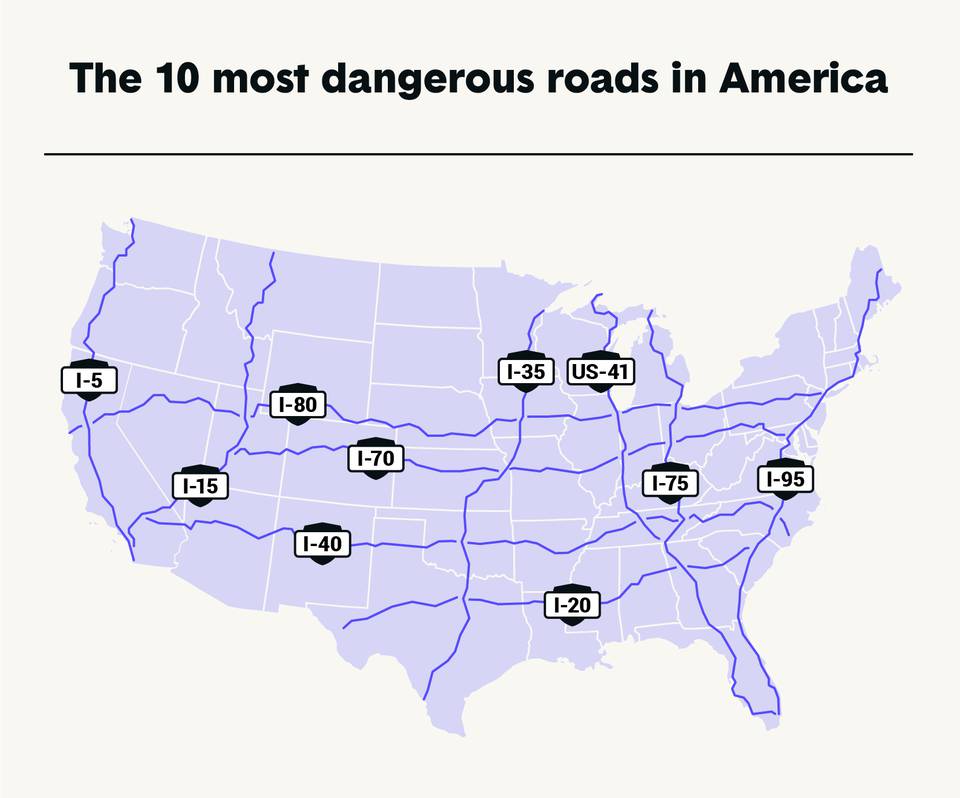
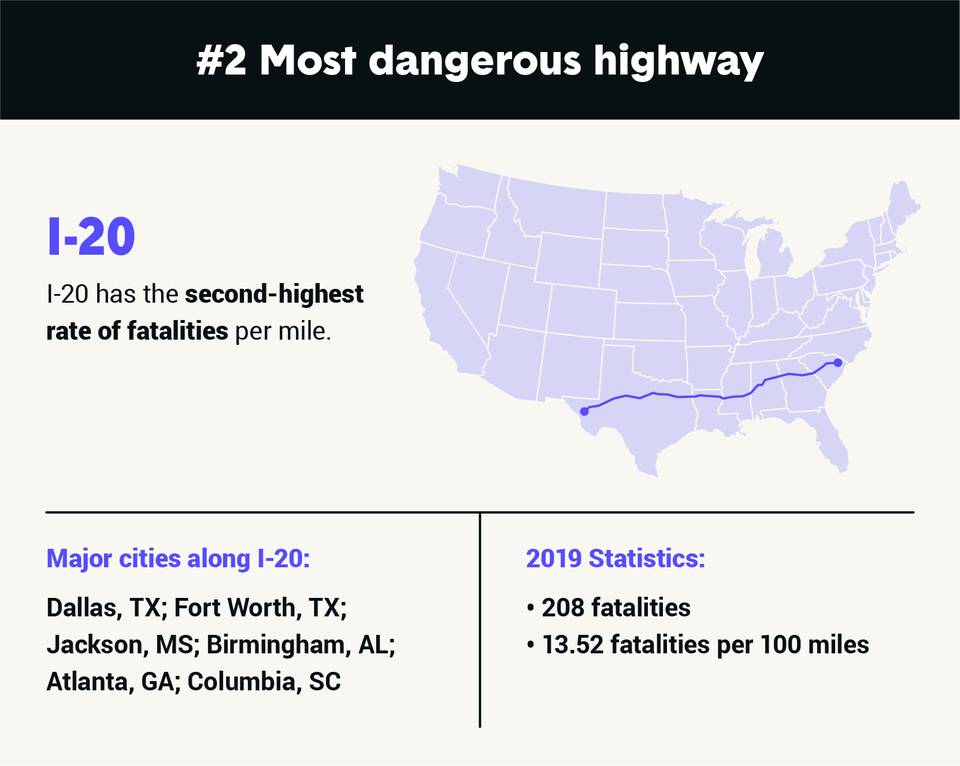
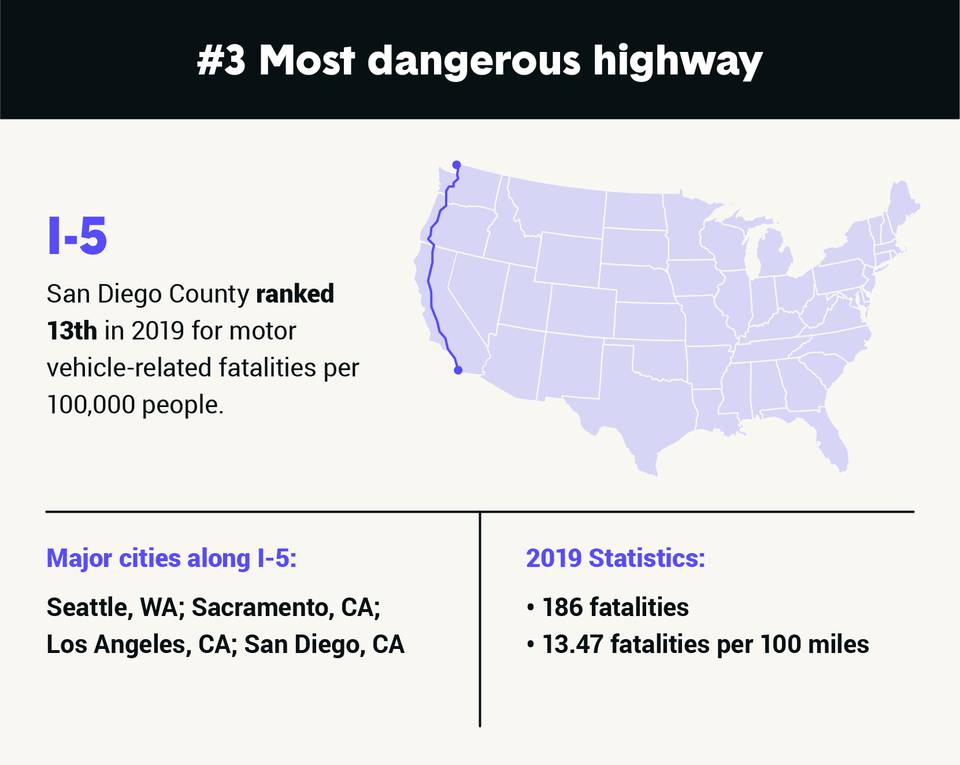
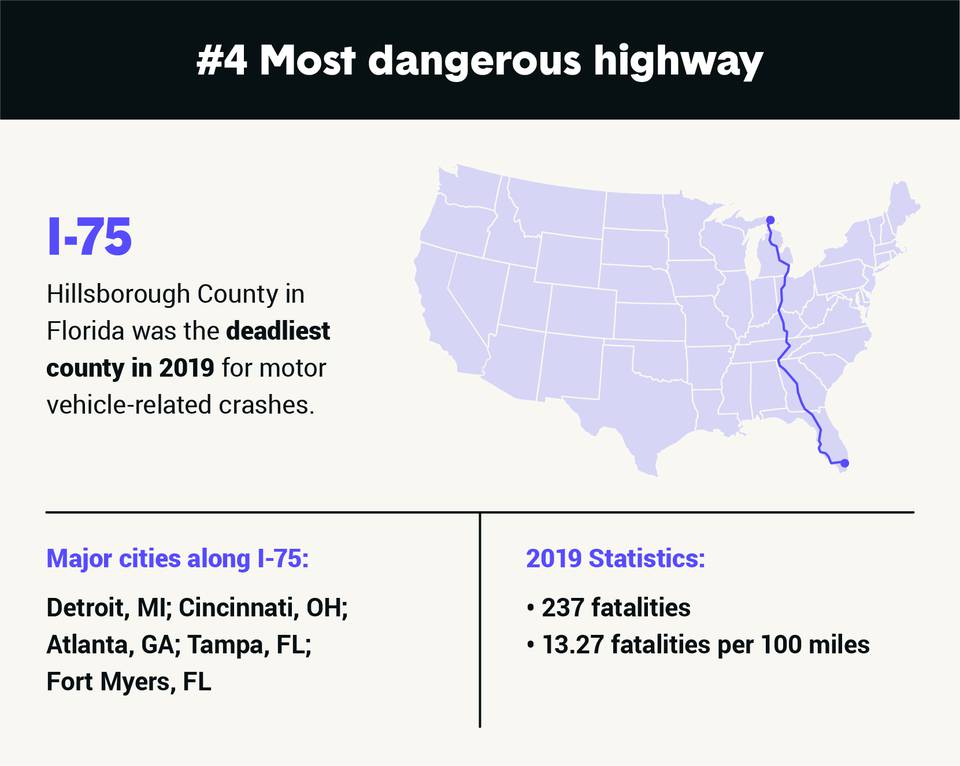
We analyzed the most recent Fatality Analysis Reporting System data to assess which roads, counties and states have the most risk for drivers based on the number of fatalities in motor vehicle collisions. You can see a summary of our results in the infographic below.

Key findings include:

  • The most dangerous highway in the U.S. is Interstate 95 (I-95).
  • Vehicle fatalities increased by an estimated 7.2% from 2019 to 2020.
  • Wyoming, New Mexico and South Carolina had the most vehicular crashes per 100,000 people.
  • Hillsborough County in Florida, which houses the city of Tampa, had the highest number of fatalities in the nation, 15 per 100,000 people.

Whether it’s your daily commute or you're planning a cross-country road trip, be aware of these 10 most dangerous roads in the U.S. along with sections of the country that have a high motor vehicle fatality rate. Also, protect yourself and your vehicle with the right auto insurance coverage in case you do find yourself in a car accident.

America’s most dangerous roads

To determine the most dangerous roads in the U.S we focused on highways with the most fatal accidents in 2019. We used 2019 data because the NHTSA has yet to release its full data for 2020 and 2021.

To determine the fatality rate, we looked at motor vehicle deaths per 100 miles for each highway across the U.S.

In 2019, 6 out of the 10 most dangerous highways ran north-south. In terms of fatalities per 100 miles, I-95 along the east coast is the most dangerous highway in the U.S. Also, US-41 was the only non-interstate highway in the top 10.

Below, you’ll find more information about the most dangerous roads and what makes them riskier than others.

 10-most-dangerous-roads.png

I-95

According to NHTSA’s data, I-95 is the most dangerous highway in the United States. In 2019, it had the highest number of overall fatalities (284) and fatalities per 100 miles (14.88).

Many of these accidents occurred in the northeast in the winter, when road conditions were far from ideal. A large portion of accidents also occurred on the east coast of Florida in Jacksonville and Brevard County, which sits outside of Orlando.

 1-most-dangerous-highway.png

I-20

I-20 is one of the shorter highways on the list but is still quite dangerous. Beginning in West Texas and continuing through South Carolina, I-20 runs through several high-traffic areas including Dallas, Texas; Jackson, Mississippi; and Atlanta, Georgia; all of which contributed to the highway’s total number of fatalities.

 2-most-dangerous-highway.png

I-5

In 2019, I-5 was the third most dangerous road in the U.S. I-5 runs 1,381 miles parallel to the Pacific Coast. The interstate runs through several major California counties including Sacramento, Los Angeles and the most deadly area, San Diego County. It’s also a popular highway for 18-wheelers to drive on, making it more dangerous for automobile drivers.

 3-most-dangerous-highway.png

I-75

I-75 runs north-south starting at the Great Lakes and ending nearly at the southern tip of Florida. Midwestern sections of the interstate, particularly in Michigan, are dangerous during the winter months when roads are icy or heavy with snow. It’s ideal to have a winter emergency kit in your vehicle if you live somewhere it often snows.

Florida also contains several dangerous areas along the Gulf Coast including Fort Myers, Sarasota and particularly Tampa.

 4-most-dangerous-highway.png

I-35

I-35 stretches from Laredo, Texas, near the Mexican border to Duluth, Minnesota, near the Canadian border. I-35 is deadly for several reasons. One, because it runs through three heavily-populated cities in Texas: San Antonio, Austin and Dallas. Secondly, I-35 is the de facto route for thousands of 18-wheeler trucks, which makes it especially dangerous to navigate in some areas.

 fifth-most-dangerous-highway.png

These most dangerous highways are typically interstate highways that stretch across the United States and intersect with populous cities and counties. Fifty-nine percent of the fatalities for the 10 most dangerous roads occurred on highways going north-south while 41% occurred on east-west highways.

California contains portions of three of the deadliest interstates in the U.S. — I-5, I-15 and I-80 — while Texas (I-20 and I-35) and Florida (I-75 and I-95) have segments of two of the deadliest interstates in the U.S.

10 deadliest highways in the U.S.
Highway 2019 Fatalities Fatalities per 100 miles
1. I-95 284 14.88
2. I-20 208 13.52
3. I-5 186 13.47
4. I-75 237 13.27
5. I-35 197 12.56
6. I-15 158 11.02
7. I-40 253 9.89
8. I-70 158 7.35
9. I-80 209 7.21
10. US-41 141 7.02

Is it becoming more dangerous to drive?

Despite Americans traveling fewer miles in 2020, there was an estimated 7.2% increase in the number of vehicle-related fatalities compared to 2019.

How can this be?

Well, according to the Federal Highway Administration (FHWA), Americans drove 430.2 billion miles less in 2020 than compared to 2019, or about a 13.2% decrease. This dramatic drop-off in mileage is in part due to the COVID-19 pandemic when a greater percentage of people stayed home.

The decrease in vehicle miles traveled (VMT) combined with an increase in vehicle-related fatalities resulted in a steep increase in the fatality rate per 100 million VMT (1.37) in 2020. This was a 26% increase from 2019 and the highest fatality rate since 2007 (1.36).

Behaviors that increase motor vehicle risk

NHTSA is still gathering and finalizing data on crash fatalities for 2020. However, from preliminary data, the federal organization suspects that the below factors attributed to the increased motor vehicle fatality rate.

Speed

According to the U.S. Department of Transportation and the NHTSA, increases in speeds across urban and rural environments occurred in 2020 compared to 2019. In fact, one report showed a median 22% increase in speeds in select metropolitan areas in 2020.

In general, a 10% change in the mean speed of traffic has more of an impact on traffic fatalities than a 10% change in traffic volume. The faster vehicles move, the more dangerous and likely fatal car accidents can be.

Seat belts

One of the most important safety features in vehicles are seat belts. First responders on the scene of a car accident have difficulty determining if a seat belt was worn or not. Therefore, it’s best to look at ejection rate, which can serve as a surrogate measure of seat belt use. Those wearing seat belts are significantly less likely to be ejected from a vehicle than those who do wear a seat belt.

From September 10, 2019, to March 16, 2020, or before the public health emergency period, the percentage of drivers with unknown seat belt use was 14%. From March 17 to July 18, 2020, that percentage increased to 19% and then 24% from July 19 to September 30, 2020. We can deduce that seat belt usage heavily declined during a large portion of 2020.

Alcohol/drug use

Along with median speed, the prevalence of DUI drivers increased in the months during the public health emergency. Cannabinoid, opioid and alcohol prevalence all increased during this time.

Based on five trauma center study sites (Charlotte, North Carolina; Jacksonville, Florida; Miami Florida; Baltimore, Maryland; and Worcester, Massachusetts), nearly a third of fatally injured drivers had alcohol in their systems, while 26% tested positive for cannabinoids and 13% for opioids, from July 19 to September 30, 2020.

Tips for driving on dangerous roads

These data points and statistics help people to understand the number of fatalities that happen on dangerous highways across the nation. To help prevent yourself and your loved ones from being in one of these accidents, follow these tips below.

 safety-tips-for-driving-on-dangerous-highways.png
  • Be extra alert: This seems obvious, but try to be extra alert when driving on dangerous highways. Act as if you’re driving in poor road conditions (heavy rain or snow or poor visibility).
  • Plan ahead: If you’re traveling long distances on a road trip or for work, plan ahead. Consider when you’ll be hitting heavy-traffic areas and the weather conditions throughout your trip.
  • Rest: If you feel drowsy, take a break and let someone else drive or pull off in a safe place for a quick nap. Here are some keen warning signs of drowsy driving: yawning or blinking frequently, difficulty recalling the past few miles driven, missing exits or drifting from your lane.
  • Obey traffic laws: Always obey the traffic laws. Not only will this prevent you from receiving a ticket, but you’re less likely to get into a fatal car accident if you’re obeying the speed limit and other traffic regulations.

Choosing to be responsible and safe behind the wheel will reduce your risk of being in a severe or even fatal accident. Moreover, part of being a responsible driver is having auto insurance to help protect yourself, your passengers and your vehicle if you are in a car accident.

 most-dangerous-roads-in-the-us.png


Methodology
To discover the most dangerous roads in the U.S., The Zebra collected and analyzed data from the U.S. Department of Transportation, NHTSA and the Fatality Analysis Reporting System (FARS). We also relied on reports from the NHTSA and other peer-reviewed traffic and motor vehicle studies. These factors were weighted and scored to calculate the final rankings.

Additional Sources: NHTSA 1 2 3 | US DOT | BizJ | Sage Journals | Census