10 best U.S. cities for withstanding climate change

Author profile picture

Susan Meyer

Senior Editorial Manager

Credentials
  • Licensed Insurance Agent — Property and Casualty

Susan is a licensed insurance agent and has worked as a writer and editor for over 10 years across a number of industries. She has worked at The Zebr…

Climate change has caused a string of weather-related reprucussions globally. In the U.S., many regions are facing an increased number of severe weather events, such as droughts and tornadoes. And these changes are impacting the people who live there, with 30% of Americans citing climate change as a compelling reason to move. 

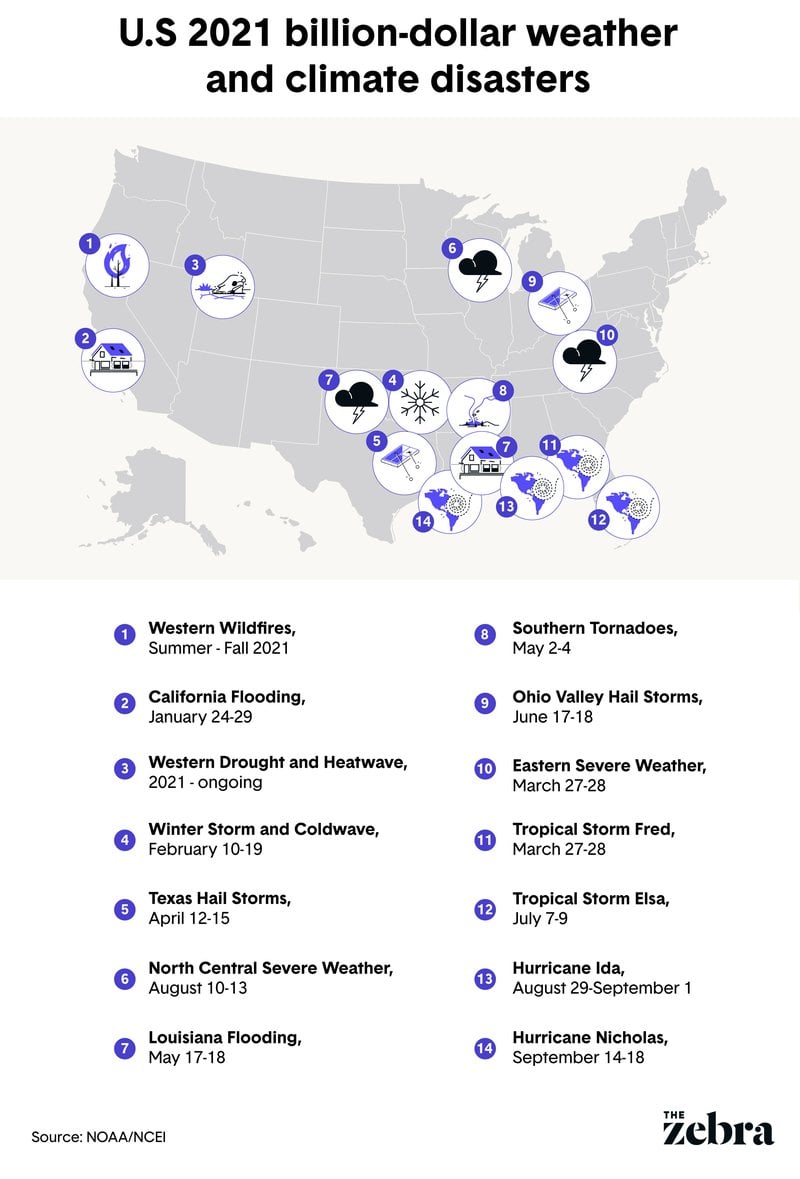
The map below shows some of the weather events that impacted the U.S. in the past year. As you can see the affects are spread across much of the country. 

weather events


If people really are willing to uproot themselves to find a home that’s better prepared for major weather changes while also offering a healthy environment, where should they go? The Zebra looked at five factors to find out.

  • EPA’s Cumulative Resilience Screening Index for Natural Hazards: The CRSI scores a city’s ability to withstand and recover from a natural disaster.
  • Number of high ozone days each year: A high ozone day means that current weather conditions in an area paired with the level of air pollution are close to the ground and can have negative health effects. 
  • Weighted average of daily particle pollution: Particle pollution comes from a variety of sources and makes the air less healthy to breathe. Common culprits causing higher particle pollution include vehicle exhaust fumes and coal-fired power plants. 
  • Number of $1billion+ weather and climate disasters in 2021: As weather patterns change, many regions are also experiencing an increased number of severe storms and other events. This can cause an enormous amount of damage to communities, including homes, businesses, and schools. The $1 billion threshold is not just for one state, but one weather event that may have impacted multiple states.
  • Global sea level risk level: Rising global sea levels due to melting glaciers increase the risk of flooding in coastal cities. Cities were ranked based on the percent chance of at least one flood over six feet taking place by 2050. 

Keep reading to find out which cities made the list as the best options for dealing with climate change.

#1: Buffalo, NY

Buffalo’s air quality is excellent based on the factors we analyzed. The city averages just one high ozone day a year and has low amounts of particle pollution. And while New York experienced six highly-damaging weather events in 2021, Buffalo is prepared to handle them based on its high CSRI score. Additionally, Buffalo is far enough inland to not be affected by rising sea levels in the immediate future. 

  • CSRI: 2.781
  • Number of high ozone days each year: 1
  • Weighted average of daily of particle pollution: 0
  • Number of $1B+ weather and climate disasters in 2021: 6
  • Chance of significant flood by 2050: 0%

#2: Minneapolis, MN

Minneapolis has good air quality, with just one high ozone day per year on average, and a daily particle pollution level of just 0.3. Severe weather events were also limited in Minnesota in 2021, making Minneapolis a great choice for a climate-inspired move. Like Buffalo, Minneapolis is no where near the coast, and so is not as affected by rising sea levels.

  • CSRI: 1.475
  • Number of high ozone days each year: 1
  • Weighted average of daily of particle pollution: 0.3
  • Number of $1B+ weather and climate disasters in 2021: 3
  • Chance of significant flood by 2050: 0%


#3: Raleigh, NC

In terms of low number of ozone days and particle pollution, Raleigh was the top city in both categories. It's also far enough from the coast to not be directly affected by sea level rise. It loses points only because it's CSRI score puts it in the bottom half of states. Additionally, North Carolina did see a few large scale disasters last year, although these were largely tropical storms which affected the coast. 

  • CSRI: 1.128
  • Number of high ozone days each year: 0
  • Weighted average of daily of particle pollution: 0
  • Number of $1B+ weather and climate disasters in 2021: 6
  • Chance of significant flood by 2050: 0

#4: Louisville, KY

Louisville has low particle polution and is inland to avoid sea level rise. It also has below the average number of ozone days per year working in its favor. Due to tornadoes and thunderstorms, the state of Kentucky did experience some billion dollar weather events in the past year. It's CSRI score is below the average. 

  • CSRI: .774
  • Number of high ozone days each year: 5
  • Weighted average of daily of particle pollution: 0
  • Number of $1B+ weather and climate disasters in 2021: 4
  • Chance of significant flood by 2050: 0

#5: Milwaukee, WI

Milwaukee has good air quality with a daily particle pollution level of just 0.3, although it does have higher than average ozone days per year. Severe weather events were limited in Wisconsin in 2021. Milwaukee's CSRI score also puts it in the top 10 of states. 

  • CSRI: 2.41
  • Number of high ozone days each year: 8
  • Weighted average of daily of particle pollution: 0.3
  • Number of $1B+ weather and climate disasters in 2021: 4
  • Chance of significant flood by 2050: 0

#6: Columbus, OH

Columbus has low levels of particle pollution as well as a relatively low number of high ozone days. Its inland position makes it safe from rising seas. Ohio did experience five billion-dollar weather events last year. Columbus's CSRI score puts it in the middle of the pack for preparedness. 

  • CSRI: 1.276
  • Number of high ozone days each year: 1.7
  • Weighted average of daily of particle pollution: 0.3
  • Number of $1B+ weather and climate disasters in 2021: 5
  • Chance of significant flood by 2050: 0

#7: Richmond, VA

Richmond has low particle pollution as well as a low number of high ozone days. ItsCSRI score is very high at 2.697, which is a good thing since Virginia was part of eight major weather disasters in 2021. These included hurricanes, tropical storms, severe winds and weather and a major winter storm.

  • CSRI: 2.697
  • Number of high ozone days each year: 0.8
  • Weighted average of daily of particle pollution: 0
  • Number of $1B+ weather and climate disasters in 2021: 8
  • Chance of significant flood by 2050: 13%

#8 Boston, MA

Massachusetts experienced just three $1B+ disasters in 2021, and Boston’s CSRI score is average for cities on our list. Particle pollution is low in Boston, but the number of high ozone days reaches nearly six per year. Additionally, as a coastal city, Boston is more likely to see the affects of rising sea levels.

  • CSRI: 1.495
  • Number of high ozone days each year: 5.5
  • Weighted average of daily of particle pollution: 0
  • Number of $1B+ weather and climate disasters in 2021: 3
  • Chance ofa. 

#9 Providence, RI

Providence has low amounts of particle pollution. Second, Rhode Island experienced only two major weather and climate disasters in 2021. Providence’s high ozone days are also above average compared to the other cities we evaluated. That said, it's a coastal city and does have a much higher chance of coastal flooding than many cities ranked higher on this list. 

  • CSRI: 1.642
  • Number of high ozone days each year: 5.5
  • Weighted average of daily of particle pollution: 0
  • Number of $1B+ weather and climate disasters in 2021: 2
  • Chance of significant flood by 2050: 76%

#10 Cleveland, OH

Cleveland has low amounts of particle pollution, although it does have its share of high ozone days per year. As mentioned above, Ohio did have five costly weather events last year, but Cleveland has a high CRSI score to help prepare it. It's yet another inland city making it less suspectible to rising sea levels. 

  • CSRI: 2.031
  • Number of high ozone days each year: 6.7
  • Weighted average of daily of particle pollution: 0.3
  • Number of $1B+ weather and climate disasters in 2021: 5
  • Chance of significant flood by 2050: 0

Methodology

The Zebra pulled four data points to analyze the top 50 MSAs (by population) in the U.S. related to climate change:

State data was used when applicable.