[STUDY] What state has the most car accidents?

Author profile picture

Susan Meyer

Senior Editorial Manager

Credentials
  • Licensed Insurance Agent — Property and Casualty

Susan is a licensed insurance agent and has worked as a writer and editor for over 10 years across a number of industries. She has worked at The Zebr…

Find the right quote options in just minutes.

Location pin icon
No junk mail. No spam calls. Free quotes.

In 2020, the National Highway Traffic Safety Administration (NHTSA) reported 35,766 fatal vehicle crashes — the most since 2007.1

While COVID-19 cleared the streets that year, many state officials believe it led to more reckless driving — citing upticks in distracted driving and drunk driving statistics as evidence of the increase. AAA found that people with reckless driving habits increased their driving during the pandemic.2

For certain states with higher accident rates in 2020, the metrics are a spike from previous years. Other states, however, maintained high accident rates for different reasons — like poor road conditions and high speed limits. 

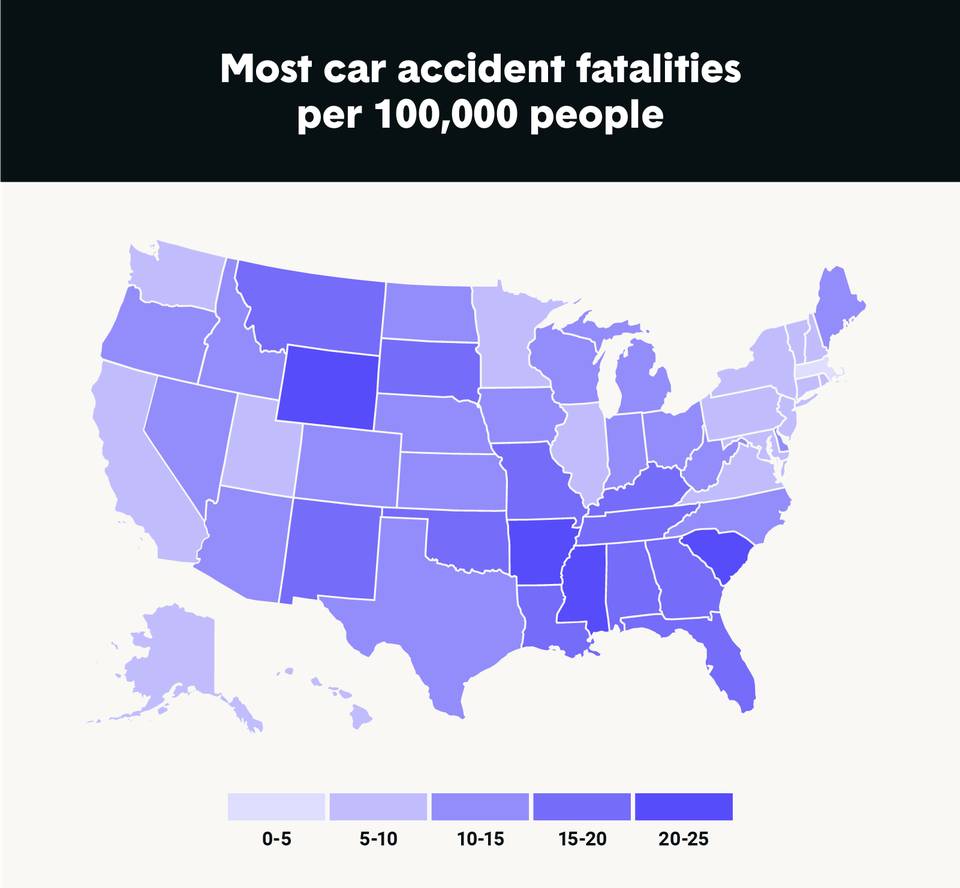
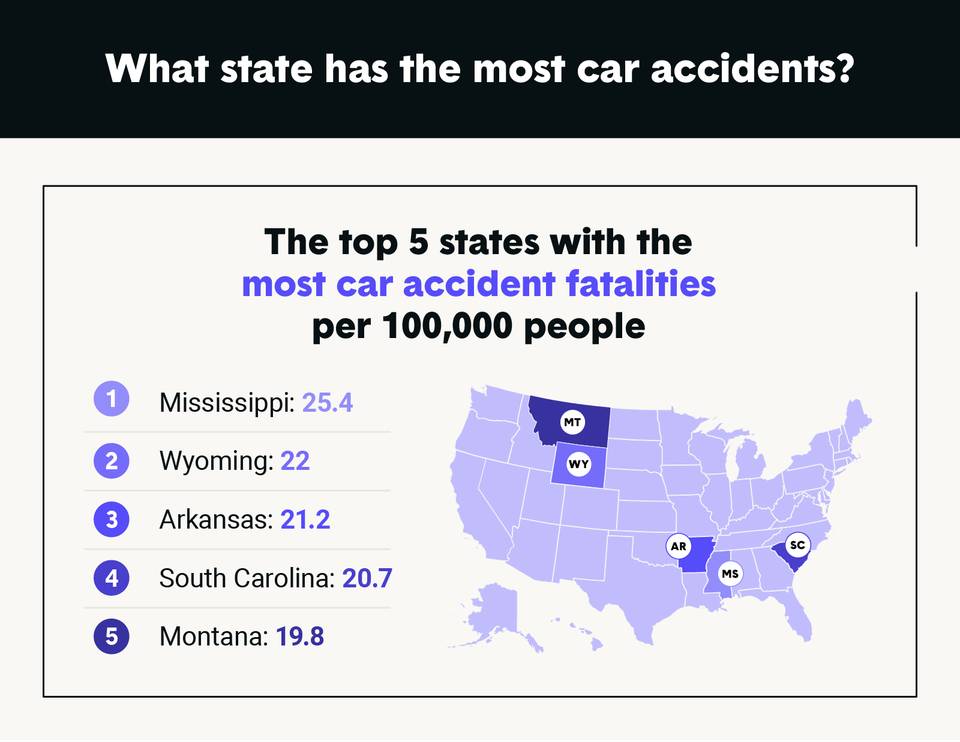
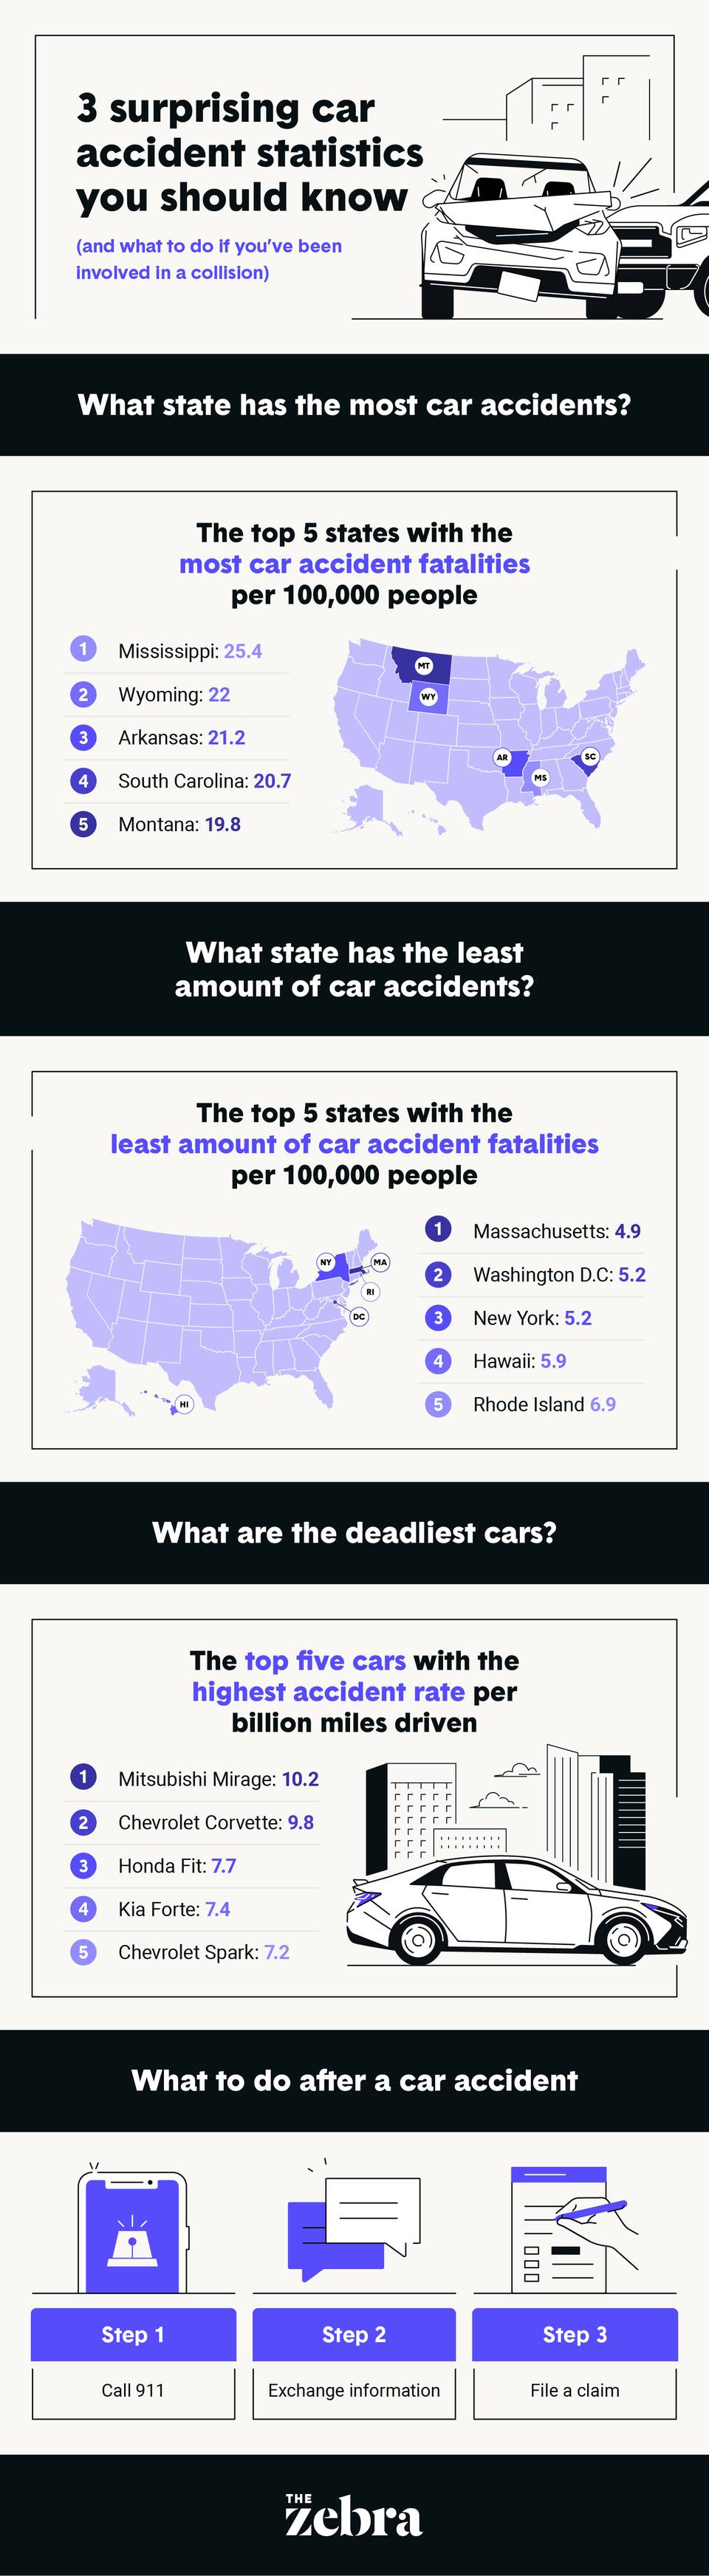
Mississippi has the highest number of fatal car accidents per population with a death rate of 22.2 deaths per 100,000 people. This number correlates with Mississippi drivers admitting to spending 8% of driving time on their phones. The state also sits amongst the lowest seat belt usage in the country.3, 4

Keep reading as we explore the five states with the highest death rate for fatal car accidents, the reasons behind the high rankings and how to navigate the process after a car accident with your car insurance company. 

Methodology: We've ranked the states by the number of deaths from car accidents per 100,000 people. The most recent data regarding fatal car accidents is from 2020, so we’ve used data from that year to inform our findings.

Passenger vehicle death statistics

Passenger vehicle death statistics highlight underlying trends in vehicle and driver safety. Some particularly telling stats include: 

  • Passenger vehicle deaths made up 62% of motor vehicle deaths in 2020. This is down from 71% in 2007.
  • 24% of passenger vehicle deaths were people under the age of 25.
  • 72% of passenger vehicle deaths were men.  

The significant decline in the number of deaths from car accidents represents auto manufacturers’ continued efforts to create the safest vehicles possible. 

Fatal car accidents by state

While Mississippi holds the number one spot for fatal car accidents per capita, car accidents can happen anywhere. The table below breaks down the number of fatal crashes and deaths per 100,000 people in each state.  

 most-car-accident-fatalities (1)
Fatal car accidents by state
State  Population  Number of licensed drivers  Fatal crashes  Deaths per 100,000 people
Alabama 5,024,803 4,042,900 852 18.6
Alaska 732,441 518,872 53 8.7
Arizona 7,177,986 5,681,495 967 14.7
Arkansas 3,012,232 2,153,929 585 21.2
California 39,499,738 27,005,302 3,558 9.7
Colorado 5,784,308 4,299,447 574 10.8
Connecticut 3,600,260 2,508,670 279 8.2
Delaware 991,886 829,226 104 11.7
District of Columbia 690,093 520,865 34 5.2
Florida 21,569,932 15,715,373 3,098 15.4
Georgia 10,725,800 7,521,750 1,522 15.5
Hawaii 1,451,911 921,547 81 5.9
Idaho 1,847,772 1,285,331 188 11.6
Illinois 12,785,245 8,225,298 1,087 9.3
Indiana 6,785,644 4,532,708 815 13.2
Iowa 3,188,669 2,268,916 304 10.6
Kansas 2,935,880 2,004,302 382 14.5
Kentucky 4,503,958 2,905,632 709 17.3
Louisiana 4,651,203 3,416,648 762 17.8
Maine 1,362,280 1,047,893 151 12.0
Maryland 6,172,679 4,454,266 540 9.2
Massachusetts 7,022,220 4,940,373 327 4.9
Michigan 10,067,664 7,026,650 1,011 10.8
Minnesota 5,707,165 4,090,264 369 6.9
Mississippi 2,956,870 2,017,111 687 25.4
Missouri 6,154,481 4,259,672 987 16.0
Montana 1,086,193 826,754 190 19.6
Nebraska 1,961,455 1,438,821 217 11.9
Nevada 3,114,071 2,056,394 293 10.2
New Hampshire  1,377,848 1,060,381 98 7.5
New Jersey 9,279,743 6,230,912 547 6.3
New Mexico  2,117,566 1,473,219 365 18.8
New York 20,154,933 12,194,360 963 5.2
North Carolina 10,457,177 7,637,400 1,412 14.7
North Dakota  778,962 539,006 96 12.8
Ohio 11,790,587 8,100,273 1,154 10.4
Oklahoma 3,962,031 2,550,560 599 16.5
Oregon 4,241,544 2,944,828 461 12.0
Pennsylvania 12,989,625 8,930,677 1,060 8.7
Rhode Island 1,096,229 731,715 66 6.1
South Carolina 5,130,729 3,905,911 962 20.7
South Dakota 887,009 658,091 132 15.9
Tennessee 6,920,119 4,877,268 1,119 17.6
Texas 29,217,653 17,667,039 3,520 13.3
Utah 3,281,684 2,149,766 256 8.4
Vermont 642,495 460,871 58 9.6
Virginia 8,632,044 5,909,716 796 9.8
Washington 7,718,785 5,812,500 525 7.3
West Virginia 1,789,798 1,101,775 249 14.9
Wisconsin 5,892,323 4,315,892 561 10.4
Wyoming 577,267 427,233 114 22

Before we dive into the states with the most fatal accidents per 100,000 people, there are a few statistics that stand out in the table above. These include: 

  • Despite having around 9 million fewer licensed drivers, Texas had only 38 fewer fatal crashes than California in 2020.
  • Despite having a larger population and more licensed drivers, Washington D.C. only saw 34 fatal crashes and 5.2 deaths per 100,000 people, while Wyoming saw 114 fatal crashes and 22 deaths per 100,000 people.
  • Despite having around double the population and number of licensed drivers, Florida had almost the same death rate as Georgia in 2020.
 most-fatal-car-accidents (1)

1. Mississippi 

As we mentioned earlier, Mississippi is the state with the most deaths per 100,000 people from car accidents. Mississippi’s standing at the top spot correlates with its positioning at the top of the list for distracted driving and lack of seatbelt usage.

Additionally, according to a study from World Population Review, Mississippi ranks fourth for worst road conditions in the nation. The study claims that 30% of Mississippi roads are in poor condition, and 11% of its bridges are structurally deficient.5 

2. Wyoming 

While Wyoming only reported 114 fatal crashes in 2020, it had a death rate of 22 per 100,000 people. 

Wyoming’s standing is largely related to the state’s prevailing drunk driving accident numbers. According to the Wyoming Department of Transportation, Wyoming reported 772 crashes involving alcohol and 38 fatalities from alcohol-related crashes. These stats make Wyoming the top state for drunk-driving-related incidents, despite having the smallest population.6

3. Arkansas 

Arkansas totaled 21.2 deaths per 100,000 people in 2020, placing it third on the list. According to the U.S. Department of Transportation, Arkansas saw a significant spike from 2019 to 2020 — an increase of around 120 fatalities from car accidents.7

According to Arkansas Online, this rise represented a 24.9% increase in fatal car crashes from 2019 to 2020 — the third largest increase in the nation. The increase was due to a rise in speeding and intoxicated driving, according to the Arkansas Department of Transportation.8

4. South Carolina 

South Carolina reported 962 fatal crashes in 2020 and a death rate of 20.7. While South Carolina takes the fourth spot for deaths per 100,000 people from car accidents, it sits at number one for deaths per 100 million miles traveled per vehicle — with a rate of 1.97.

According to a Consumer Affairs study, South Carolina has some of the worst roads in the country — claiming the number 12 spot in 2021 after previously having the top spot in 2020. The study claims that 12% of urban South Carolina roads have rough pavement.9

5. Montana 

Montana ranks highly for both death rate and deaths per miles traveled — reporting 19.6 and 1.76, respectively. Montana is also one of the most dangerous states for drunk driving, with 66% of vehicle fatalities coming as a result of impaired driving.10

Montana, interestingly, reported 3,563 crashes involving animals in 2020 — 10 of which resulted in fatalities. 93% of fatal crashes in Montana additionally occurred on rural roads.11

What state has the least amount of fatal car accidents?

The bottom of the list comes with some surprises — as the states with the least car accidents don’t see much correlation with population and number of licensed drivers. 

For example, Massachusetts has the least amount of car accidents, claiming a rate of 4.9 car accident fatalities per 100,000 people. The state claimed only 327 fatal car accidents in 2020.

The states with the least amount of car accidents are:

 least-car-crashes (1)

The states with the least amount of car accidents represent a mix of some cities with highly concentrated urban areas and some of the least populated states. However, some other notable takeaways from the list are: 

  • Washington D.C. and Rhode Island ranked first and second, respectively, for the lowest number of alcohol-related fatal crashes in 2020.12
  • Massachusetts state law requires more jail time for a DUI than any other state.13
  • Hawaii has the lowest speed limits of any state.14

What are the deadliest cars?

While car accidents in these specific states can be a result of any number of factors, there are certain types of cars that are routinely cited as the deadliest in fatal accidents.

According to the Insurance Institute for Highway Safety, small cars and minicars accounted for 15 of the 20 models with the highest death rate in  2017. Luxury SUVs proved to have the lowest death rate for the same year.15    

According to IIHS data, the Mitsubishi Mirage is the deadliest car, with a fatal accident rate of 10.2 (cars per billion miles driven). The table below shows the five deadliest cars and their accident rate from the model years 2013 to 2017.

 the deadliest cars

Sports cars and subcompact vehicles tend to be the most represented on lists of deadliest cars. Sports cars usually prioritize speed and acceleration over most safety features, while subcompact cars often lack safety features due to their size. 

When examined by size, subcompact cars had a fatal accident rate of 4.5 while large cars saw a rate of 2.6 — a difference of nearly 50%.16

Do car accident statistics affect insurance premiums?

The average cost of car insurance in different states is not directly dependent on the number of car accidents, but it can depend on factors that lead to more accidents, like severe weather, heavy traffic patterns, population density and percentage of urban areas. 

Michigan, for example, has the highest car insurance premiums in the nation. The state is in the upper echelon for population density and percentage of urbanites — two factors for higher car insurance premiums. The state has an average annual premium of $5,282.

Iowa, on the other hand, sees the lowest average annual premiums as the state is largely rural and has a low population density. As a result, Iowans pay only $357 in average annual premiums.17

What to do after a car accident

Car accidents can happen anywhere, so it’s crucial to know the steps to take after an accident — even if you don’t live in one of the top-ranking cities for car accidents. 

If you get in a car accident, it’s important you get in touch with your insurance company early to ensure you’re protected after an accident. Once you take necessary safety precautions like checking yourself and your passengers for injuries, you should:

 what to do after a car accident

1. Call 911

No matter the magnitude of the accident, the police will file an accident report once they arrive on the scene. When you report the accident to your insurer, they’ll likely ask for a copy of the police report to help you through the claims process. 

2. Exchange information with the other party 

Determining the at-fault party is a hugely significant part of the claims process, so it’s essential both parties exchange information at the site of the accident. 

Later on in the process, the adjuster will review information from the accident, like damage to the vehicles and other information you provide. Therefore, it’s best to document as much information as you can at the scene. 

3. File a claim with your insurance company 

Once you collect all necessary materials, pass the information along to your insurance company and get the claims process underway. With some insurance companies, you can contact an agent through their mobile app while you’re at the scene of the accident and ask for the information you’ll need to file a claim. 

In some cases, insurance rates can increase after you file a claim. If you’re debating between filing a claim or paying for damages out of pocket after a car accident, consult our insurance claims calculator to get an estimate today.

shield
Have more questions?

Consult our guide on steps to take after an accident for detailed instructions and best practices. 

 what-state-has-the-most-car-accidents-ig_1_1.compressed (1)