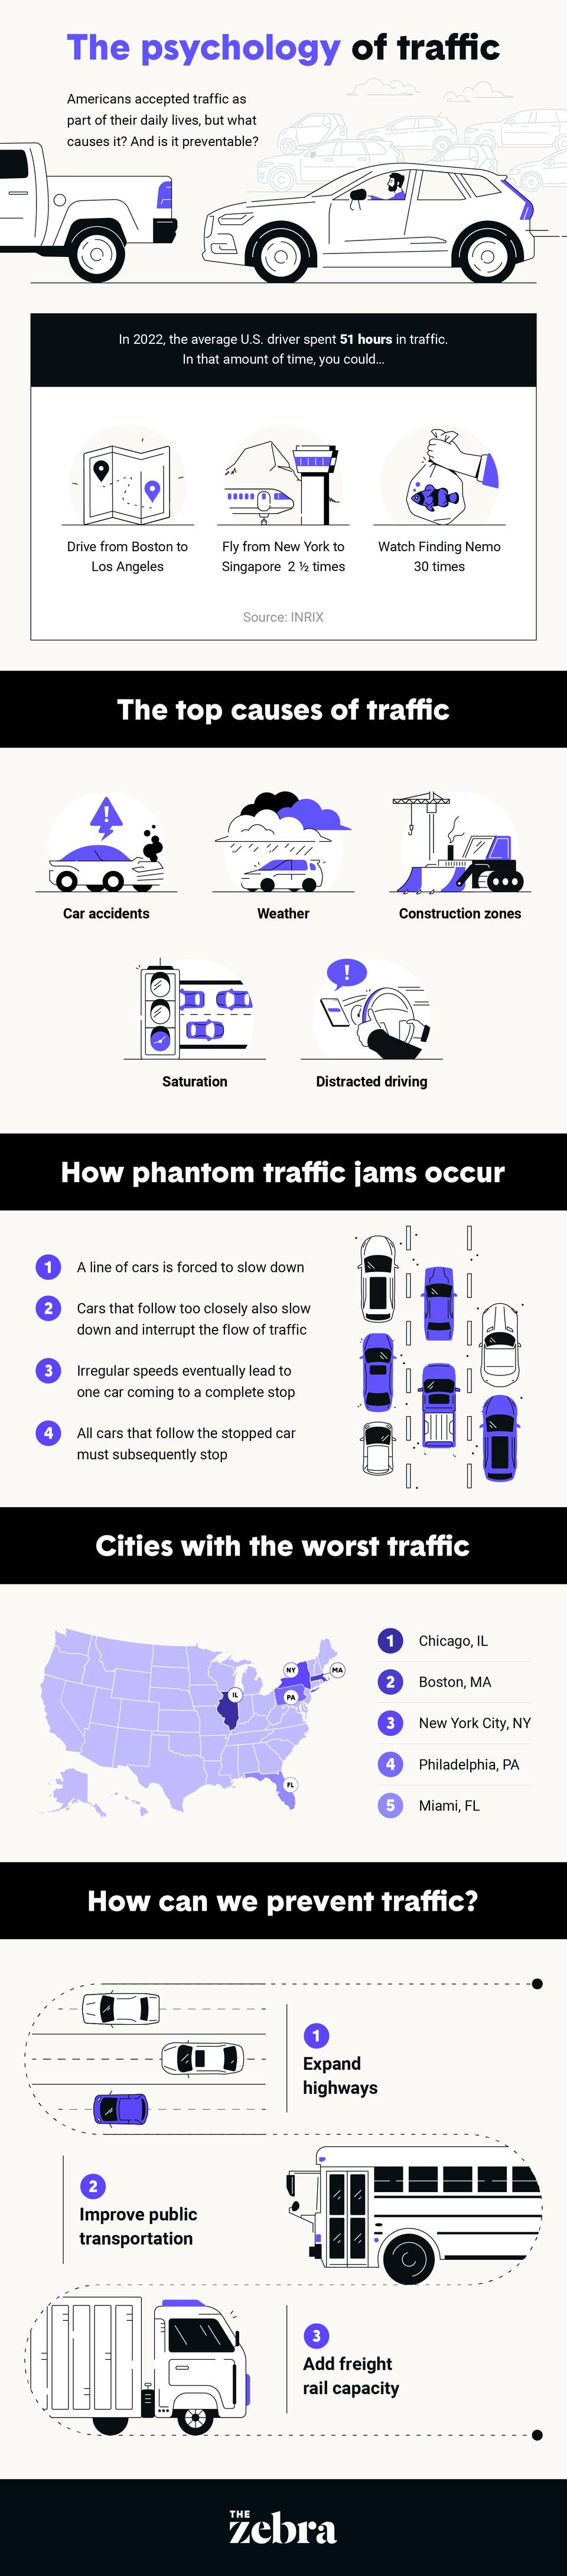
What causes traffic? Understanding why we wait behind the wheel

Author profile picture

Susan Meyer

Senior Editorial Manager

Credentials
  • Licensed Insurance Agent — Property and Casualty

Susan is a licensed insurance agent and has worked as a writer and editor for over 10 years across a number of industries. She has worked at The Zebr…

According to the Mobility Analytics Firm Inrix, the typical driver lost 51 hours to traffic in 2022 — almost an hour each week. The total was an increase of 15 hours from 2021 — with certain cities, like Boston and Chicago seeing over 40% increases in hours lost due to traffic from 2021 to 2022.[1]

For most commuters, traffic — and the endless hours spent in it — is a normal part of everyday life. But what actually causes traffic? Sure, accidents happen or freeways experience construction, but what about when traffic stalls for seemingly no reason? 

In this post, we’ll explore the top causes of traffic, the phenomenon of the “phantom traffic jam,” possible solutions to alleviate traffic and whether or not more traffic means more car accidents.

How does traffic start?

Traffic can start for many reasons. There are the usual suspects, like accidents and construction, but also some lesser-known causes. Some of the leading causes of traffic congestion include: 

 top causes of traffic

Car accidents 

According to the Bureau of Transportation, around 13 car accidents happen per minute — making them the leading cause of traffic nationwide.[2]

Contributing to 25% of traffic jams, car accidents are a consistent source of traffic. Whether it’s a pile-up or a fender bender, accidents can cause congestion or full stops on the road. 

Construction zones 

Most common during the summer, work zones tend to cause congestion through lane closures, detours and decreased speed limits. 

Not only do work zones slow traffic and create congestion, but research shows that they’re also a leading cause of traffic accidents. From 2015 to 2022, the number of fatalities related to work zones was over 35,000. There was also a 21% increase from 2020 to 2022.[3] 

Weather 

Even the cities with the best weather experience periods of heavy rain from time to time. According to the U.S. Department of Transportation, the average driving speed typically decreases from 3% to 16% during heavy rain, and heavy snow can decrease speeds from 5% to 40%.[4]

Flooding, as well as debris that’s blown onto the road from heavy winds, can additionally increase traffic. Like construction zones, harsh weather conditions lead to more car accidents — and thus, more traffic. 

Saturation  

While you may think of saturation as just a fancy way of saying “traffic,” it’s actually an official term used in traffic engineering. Saturation refers to the maximum amount of traffic a specific junction can handle, whether it's an interstate, highway or simple roadway. 

When the amount of vehicles on a roadway exceeds its capacity, slowdowns naturally begin. Even if there’s not an accident on the roadway, saturation will naturally occur purely because of the ratio of vehicles to available space.[5]

Distracted driving

Research shows that distracted driving is a factor in over 8% of accidents, making it one of the leading causes of car accidents and thus a primary cause of traffic. 

Not only does distracted driving pose a risk to the safety of drivers, but it can also interrupt the flow of traffic and create congestion. Cell phones or other tech can cause drivers to lose track of their spacing, causing fender benders that lead to stoppages.

Is there always a reason for traffic?

Once we see the other side of a traffic jam, there’s typically a car accident or a construction zone at the end of the line. But what about those traffic jams that just seem to appear randomly? 

This kind of traffic is known as a phantom traffic jam, and its causes are a little more complex.

What are phantom traffic jams? 

 how phantom traffic jams occur

Phantom traffic jams occur during periods of dense traffic when a car, or multiple cars, follows another car too closely. If the car in front slightly slows down, it causes them to slow down as well, leading to all the following cars slowing until one has to come to a complete stop. Then, all the cars behind it also have to stop. 

Phantom traffic jams are largely the result of one car slowing down due to following another too closely. Keeping more space between your car and the vehicle in front of you can be pivotal in stopping phantom jams from forming. 

How to prevent phantom traffic jams

Most driving schools preach the “two-second rule,” meaning you should keep at least two seconds’ worth of space between your car and the car in front of you. To adhere to the two-second rule, first pick a reference point, like a street sign or tree. When the car in front of you passes the reference point, count to two. If you pass the reference point before you finish counting, you’re following too closely and need to adjust your distance.[6]

In theory, it sounds great that every car would stay equidistant from each other in periods of dense traffic — but it’s not practical. As a result, advancements in autonomous safety features are likely our best bet for levying the effects of phantom jams. 

Adaptive cruise control, which can more accurately notice the space between your car and the car in front of you, has become an increasingly helpful feature for drivers. Self-driving cars, when improved, should additionally play a role in limiting the formation of phantom traffic jams.

Where is traffic the worst?

The average driver in the U.S. spends 51 hours in traffic per year, but it’s far worse in specific cities. 


The five worst cities for traffic are:

  1. Chicago, IL
  2. Boston, MA
  3. New York City, NY
  4. Philadelphia, PA
  5. Miami, FL
 cities with the worst traffic

Hours spent in traffic per year

These cities sat well above the average in terms of hours lost due to traffic. For each of the cities, residents lost the following number of hours due to traffic in 2022: 

  1. Chicago, IL: 155 hours lost per driver
  2. Boston, MA: 134 hours lost per driver 
  3. New York City, NY: 117 hours lost per driver 
  4. Philadelphia, PA: 114 hours lost per driver 
  5. Miami, FL: 105 hours lost per driver 

Highest increase in congestion (2021-2022) 

While traffic isn’t nearly as bad as it was prior to the start of the COVID-19 pandemic, 2022 saw significantly more congestion than in 2021 as more Americans made their way back to the office. Each of the following cities saw increases from 2021 to 2022. 

  1. Chicago, IL: +49% 
  2. Boston, MA: +72% 
  3. New York City, NY: +15% 
  4. Philadelphia, PA: +27% 
  5. Miami, FL: +59% 

While many U.S. locations accounted for cities with the most traffic worldwide, according to the 2022 Inrix’s Global Traffic Scorecard, London took home the number one spot — with the average driver losing 156 hours annually to traffic.

The cost of traffic in the U.S.

We’ve determined the causes of traffic jams and where they’re the worst, but how big of a problem are they? We’ve mentioned that the typical U.S. driver lost 51 hours in 2022. While some commuters in cities with dense traffic may scoff at this number, consider this: 

  • 51 hours lost translates to $869 in lost time, per driver.
  • From 1982 to 2019, traffic congestion led to $190 billion lost each year due to lost time and wasted gas.[7]

Beyond these financial repercussions, there are health concerns as well: 

  • Over 11 million Americans live within 150 meters of a highway and are therefore vulnerable to air pollution from traffic congestion.[8]
  • Air toxins related to traffic can affect pregnancies for those living in close proximity to highways, including preterm birth.[9]

As America continues to add highways and interstates while traffic worsens, the severity of these problems grows. This is why it's pivotal that urban planners and auto manufacturers prioritize traffic prevention.

How can we prevent traffic?

Traffic flow can be improved by more advanced automation like adaptive cruise control and self-driving vehicles. However, there are other ways cities can adapt their infrastructure to alleviate traffic congestion. 

According to the Federal Highway Administration, adding capacity is a key strategy for improving traffic flow in busy cities.[10] Adding capacity could mean:

 how can we prevent traffic
  • Adding more lanes to highways 
  • Building more public transit opportunities, such as buses and rail systems
  • Adopting high-occupancy vehicle (HOV) lanes in more cities 
  • Increasing freight rail capacity to limit the number of trucks on city highways

In addition to these improvements, cities can adopt other forms of technology to help alleviate traffic. Smart cities, for instance, collect information from residents in real time to make data-backed improvements, like reducing traffic. 

Chicago, for example, launched an app that allows residents to view current traffic flow, see updated bus schedules and pay tolls online. By giving commuters this information, there’s hope that they will make more efficient and informed travel decisions.

Does more traffic mean more car accidents?

When analyzing the states with the most fatal car accidents, the frontrunners include states that are largely rural with high distracted and drunk driving incidents — like Mississippi, South Carolina and Wyoming. 

This isn’t to say that the cities with high-traffic congestion are devoid of accidents, in fact, they likely have more. Rather, these cities see more accidents due to congestion, such as rear-end collisions and fender benders. 

If you’re a commuter in a city with a high traffic volume, the chances of getting dinged by another vehicle are high. Compare car insurance companies today to ensure your policy meets the needs of your garaging location.

 psychology of traffic