[STUDY] Ticketed for distracted driving? Prepare to pay 23% more for car insurance

Author profile picture

Susan Meyer

Senior Editorial Manager

Credentials
  • Licensed Insurance Agent — Property and Casualty

Susan is a licensed insurance agent and has worked as a writer and editor for over 10 years across a number of industries. She has worked at The Zebr…

Author profile picture

Ross Martin

Insurance Writer

Credentials
  • 4+ years in the Insurance Industry

Ross joined The Zebra as a writer and researcher in 2019. He specializes in writing insurance content to help shoppers make informed decisions.

Ross h…

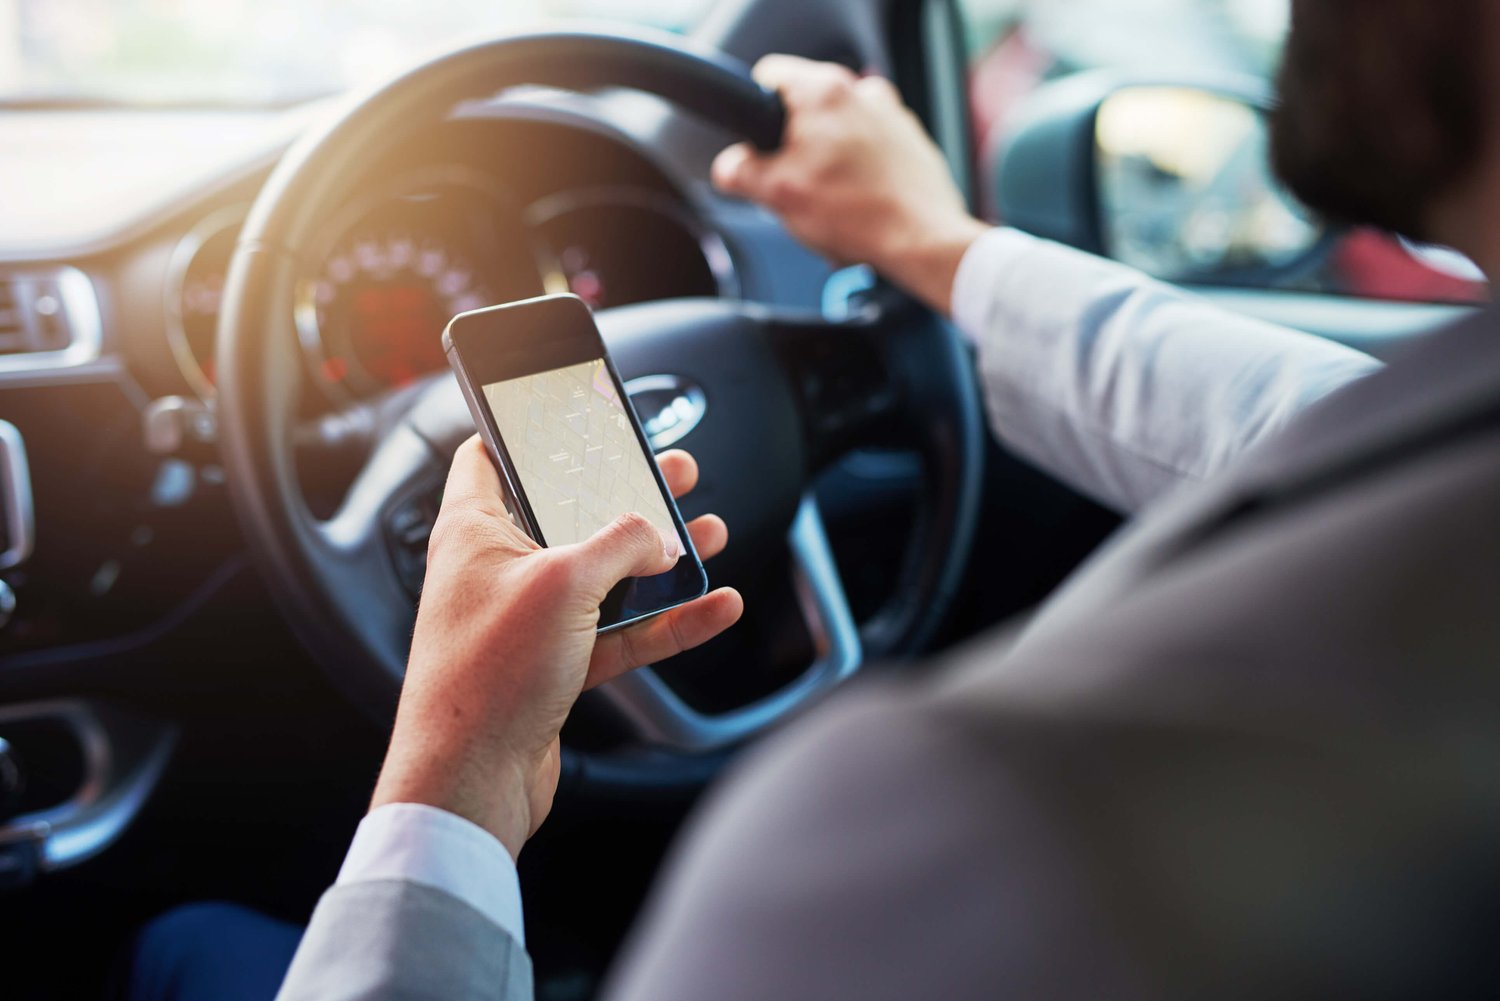
Whether you’re alone or with passengers, driving a car requires your undivided attention. Unfortunately, too many drivers still give in to distractions on the road — despite the growing repercussions. 

New research from The Zebra finds that the penalties that car insurance companies typically charge distracted drivers have increased exponentially over the past decade. Since 2011, the average insurance penalty for distracted driving went from about the cost of a latte ($5) to what you might pay for a fancy espresso machine ($357). 

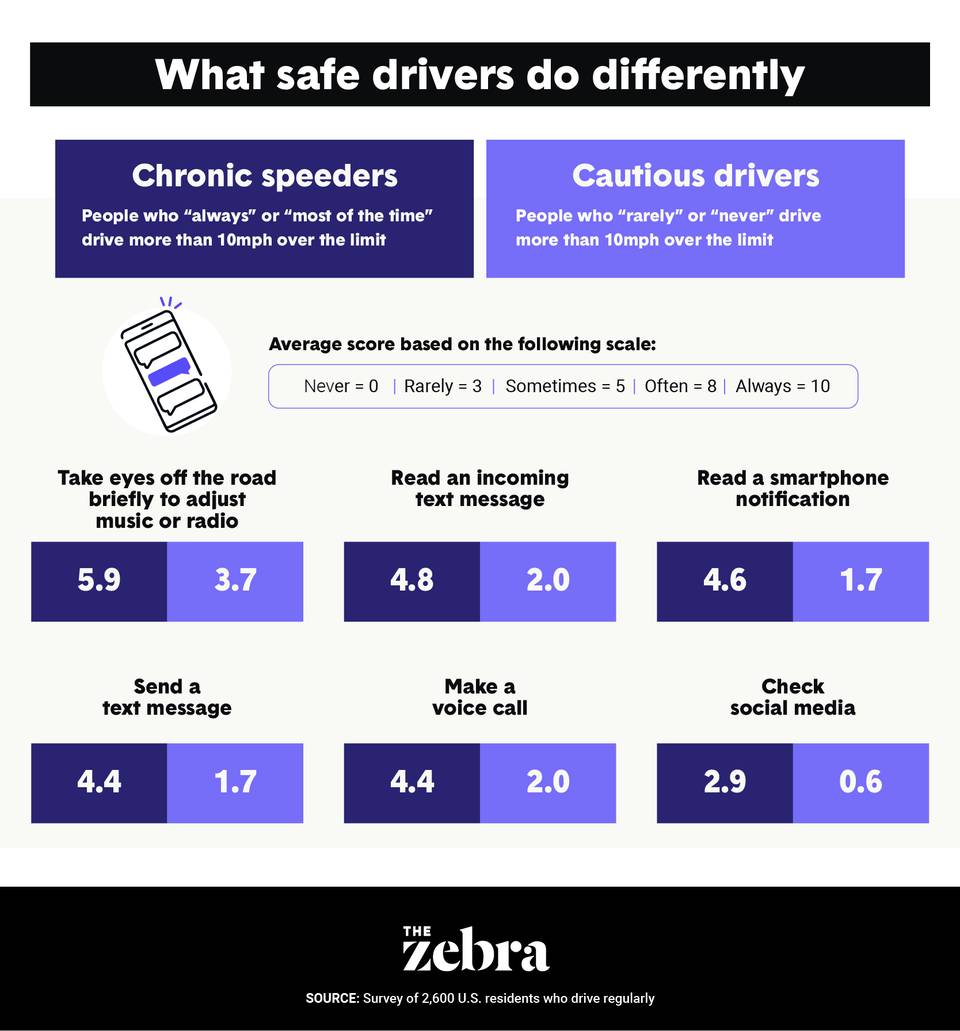
Despite this, drivers are more distracted than ever. To better understand the temptations of distracted driving, we surveyed 2,600 people in 25 cities across America about the types of distractions they’ve experienced. 

Among our key findings: 

  • Smartphones aren’t the only things that distract drivers. A majority of people have read a message or sent a text while driving, but 1 in 4 drivers have also put on or taken off clothing while operating a vehicle (26.8%). About 1 in 7 drivers have applied makeup or deodorant (15.2%), engaged in sexual activity (14.9%), or hit a passenger (12.4%) while driving.
  • New Yorkers admit to the most distracted driving followed by Washington, D.C., and St. Louis inhabitants. Seattle residents are America’s least distracted drivers.
  • Generation Z drivers are most distracted, with distraction rates dropping significantly after age 40. Baby Boomers reported the lowest distraction rate.
  • Nearly two-thirds of U.S. drivers (62.9%) say, “I know I shouldn’t use my phone while driving, but I do, anyway.”

Before we dive deeper into the survey finding, let’s take a closer look at what distracted driving can cost.

Distracted driving now spikes car insurance rates 23% 

An analysis of insurance rates* by The Zebra shows that insurers are cracking down more seriously on distracted drivers. 

The graph below shows how a distracted driving ticket increases the cost of car insurance — and how that cost has changed over time.

 distracted-drivers-edits-v2-11.png

In 2011, a driver cited for distracted driving would pay only .4% ($5) more for car insurance than a driver with a clean driving record. Now a distracted driving violation raises rates an average of 23% ($357) — a penalty increase of 7,040% since 2011.

If that’s not enough of a deterrent, distracted drivers should know that a violation typically impacts your car insurance rate for three years. That means getting caught checking your phone at the wheel could cost you an additional $1,071 for insurance, on top of what you owe for traffic fines and court costs.

Different locations, different impacts

Just like each state has its own distracted driving laws, the insurance impact of distracted driving can be different from one place to the next.

Drivers in Connecticut pay the biggest insurance penalties for distracted driving, with rate increases averaging 64% ($1,083). Drivers in the state of New York pay the smallest distracted driving penalties of only 4% ($62).

Insurance penalties for distracted driving, ranked by state

Rank State Avg. Rate –No violation Avg. Rate –With violation $ Difference % Difference
1 Connecticut $1,696 $2,780 $1,084 64%
2 Vermont $1,156 $1,738 $582 50%
3 California $1,868 $2,674 $806 43%
4 North Carolina $955 $1,287 $332 35%
5 New Jersey $1,592 $2,143 $550 35%
6 Oregon $1,463 $1,964 $501 34%
7 Ohio $1,047 $1,387 $340 32%
8 Massachusetts $1,463 $1,936 $474 32%
9 Arizona $1,470 $1,925 $455 31%
10 Montana $1,534 $2,004 $470 31%
11 Wisconsin $1,181 $1,524 $344 29%
12 Georgia $1,609 $2,072 $463 29%
13 Mississippi $1,587 $2,036 $448 28%
14 Illinois $1,303 $1,670 $367 28%
15 Oklahoma $1,787 $2,281 $494 28%
16 Arkansas $1,698 $2,167 $469 28%
17 Michigan $3,096 $3,937 $841 27%
18 New Hampshire $1,037 $1,304 $267 26%
19 Washington $1,368 $1,720 $352 26%
20 Florida $2,309 $2,883 $574 25%
21 Virginia $1,005 $1,248 $242 24%
22 West Virginia $1,536 $1,905 $369 24%
23 Rhode Island $2,103 $2,595 $492 23%
24 Arkansas $1,275 $1,567 $292 23%
25 Louisiana $2,379 $2,917 $538 23%
26 New Mexico $1,334 $1,620 $287 22%
27 Nevada $1,974 $2,390 $417 21%
28 Missouri $1,736 $2,101 $365 21%
29 Minnesota $1,319 $1,596 $277 21%
30 Tennessee $1,570 $1,899 $329 21%
31 Indiana $1,165 $1,408 $243 21%
32 Delaware $1,803 $2,173 $370 21%
33 North Dakota $1,379 $1,656 $277 20%
34 South Dakota $1,708 $2,044 $335 20%
35 Colorado $1,757 $2,101 $344 20%
36 Maine $935 $1,117 $182 19%
37 Iowa $1,106 $1,317 $211 19%
38 Washington, D.C. $1,383 $1,645 $263 19%
39 Kentucky $2,208 $2,623 $415 19%
40 South Carolina $1,414 $1,670 $257 18%
41 Nebraska $1,370 $1,604 $234 17%
42 Hawaii $1,045 $1,215 $170 16%
43 Utah $1,306 $1,515 $209 16%
44 Idaho $1,164 $1,346 $182 16%
45 Maryland $1,415 $1,629 $214 15%
46 Kansas $1,622 $1,861 $239 15%
47 Alabama $1,450 $1,635 $185 13%
48 Pennsylvania $1,475 $1,617 $143 10%
49 Texas $1,415 $1,538 $122 9%
50 Wyoming $1,439 $1,556 $116 8%
51 New York $1,704 $1,766 $62 4%

These impacts can vary widely from state to state due to a broad variety of factors: state insurance laws and regulations, population density, local car repair costs, and more. 

Twenty-one states and Washington D.C. prohibit drivers from using hand-held phones and devices while driving, and all but two states (Montana and Missouri) prohibit texting while operating a motor vehicle. 

Despite the risks, more than half of drivers surveyed for this report admit to driving while distracted. 

New York City has the most distracted drivers

We asked 2,600 people in 25 cities across the country how often they send text messages, read notifications, answer calls, adjust the radio, check social media, and more during a typical 30-minute drive. Within 10 categories, a score of 0 signifies “Never” and a 10 signifies “Always,” meaning that the aggregated total could add up to a maximum score of 100 for any given city. Here’s how the cities stacked up: 
 which cities drivers are most distracted

If you’ve ever driven in New York City, you’re probably not surprised that the Big Apple leads the country in distracted driving behavior with an overall score of 43.7 out of 100. 

The nation’s capital, Washington D.C., came in second at a score of 40.2. The area with the least amount of distracted driving — and the only area below the 30-point mark — was the Seattle-Tacoma area at 29.5 out of 100. It’s worth noting that the state of Washington was also the first state to pass a texting ban, in 2007, which could explain why its drivers are among the least distracted. 

What distracts us on the road?

The Centers for Disease Control and Prevention has identified three main types of distractions while driving: taking your eyes off of the road (visual), taking your hands off of the wheel (manual), and taking your mind off of driving (cognitive). 

We asked drivers how often they engage in some common distracted driving behaviors. 

 what distracts us

Not surprisingly, using a smartphone or other device tops the list of things people have done while driving. A total of 58% of respondents stated that they’ve read something on a phone or other device, and 56% admitted that they’ve texted while behind the wheel. 

One in 3 drivers (35.9%) admitted to eating a full meal while driving.  “Dashboard dining,” while not quite as dangerous as texting, can still hinder your driving abilities. The same goes for personal hygiene like brushing your hair (17.5%) and putting on makeup or deodorant (15.2%)

Demographics of Distraction

The survey results reveal slight differences in how people from different age groups and demographics engage in distracted driving.

 who is most distracted

The distraction score for men was 35.7 out of 100, compared to 35.4 for women, suggesting that men are slightly more prone to distracted driving — or more willing to admit to it. 

Drivers in rural areas or small towns were also more likely to drive distracted than those in suburbs or cities. According to the Insurance Institute for Highway Safety, almost half of crash deaths occur in rural areas, even though only 19% of U.S. residents live in the countryside.

Members of Gen Z, the youngest group of drivers on the road today, were the most likely to multitask behind the wheel, followed closely by millennials. Baby boomers reported the least distracted driving.

Chronic speeders are much more likely to drive distractedly

We asked our 2,600 drivers how often they drove more than 10 miles per hour over the speed limit and compared their distraction scores. The correlation we found between speeding and distracted driving was stark: Drivers who admitted to driving more than 10 mph over the limit “all the time” or “often” had an average total distraction score of 45.5 out of 100, while drivers who said they “rarely” or “never” speed had an average score of 28.8.  

Drivers who routinely go 10 mph or more over the speed limit are significantly more likely to engage in every type of distracted behavior, particularly texting and reading notifications. Habitual speeders are more than twice as likely to respond to or send a text message while driving than those who don’t speed. 

 risky behaviors

According to the National Highway Traffic Safety Administration, speeding contributed to 1 out of every 3 car crash fatalities over the past two decades. That makes speeding while distracted an especially risky combination. 

 what safe drivers do differently

How does using a smartphone affect our driving?

A majority of survey respondents, nearly 60%, said using a phone behind the wheel caused their driving to get slightly or significantly worse. 

 smartphones affect driving performance

This suggests that many drivers are aware their own driving abilities are hampered by distractions — but they’re not ready to change their habits. 

Nearly two-thirds of U.S. drivers (62.9%) said, “I know I shouldn’t use my phone while driving, but I do, anyway.” 

 rationalize smartphones driving

While drivers should avoid distractions that take their eyes off the road or their hands off the wheel, recent research suggests hands-free systems could be OK.


Researchers from the Virginia Tech Transportation Institute found that “talking on a hands-free device does not appear to have any detrimental effects” on a driver’s performance, because the driver is still likely to be focusing straight ahead on the road.

Conclusion

Though more than 2,800 people lost their lives in distracted driving-related crashes in 2018, there may be good news on the horizon. Statistics from the National Highway Traffic Safety Administration show that the number of fatal car crashes involving distracted driving dropped from 9.2% in 2017 to  8.4% 2018. 

 This and our survey findings suggest that drivers are starting to heed public safety warnings about the dangers (and costs) of distracted driving.

Methodology

Our survey was conducted online. We polled 2,605 U.S. residents who drive regularly – including at least 100 people in each of 25 major American cities. The sample included 1,305 men and 1,300 women. They ranged in age from 18 to 78, with a median age of 34. 

The cities were chosen based on population, media market size, and geographic location. They were:

  • Atlanta, GA
  • Baltimore, MD
  • Boston, MA
  • Charlotte, NC
  • Chicago, IL
  • Cleveland-Akron, OH
  • Dallas-Ft. Worth, TX
  • Denver, CO
  • Detroit, MI
  • Houston, TX
  • Indianapolis, IN
  • Las Vegas, NV
  • Los Angeles, CA
  • Miami-Ft. Lauderdale, FL
  • Minneapolis-St. Paul, MN
  • Nashville, TN
  • New Orleans, LA
  • New York, NY
  • Philadelphia, PA
  • Phoenix, AZ
  • Pittsburgh, PA
  • San Francisco- Oakland-San Jose, CA
  • Seattle-Tacoma, WA
  • St. Louis, MO
  • Washington, DC

The survey was based on self-reporting, which can have limitations. However, the margin of error was ±1.92% with a confidence interval of 95% based on the population of 28.05 million adults in the target cities.  

*Rate data is based on The Zebra’s analysis of 73 million car insurance rates across U.S. ZIP codes including Washington D.C. conducted between September and December 2019. The analysis uses a consistent base profile for the insured driver: A 30-year-old single male driving a 4-year-old Honda Accord EX with a good driving history and coverage limits of $50,000 bodily injury liability per person/$100,000 bodily injury liability per accident/$50,000 property damage liability per accident with a $500 deductible for comprehensive and collision. Data may vary slightly due to rounding.