10 worst cities for driving conditions

Author profile picture

Susan Meyer

Senior Editorial Manager

Credentials
  • Licensed Insurance Agent — Property and Casualty

Susan is a licensed insurance agent and has worked as a writer and editor for over 10 years across a number of industries. She has worked at The Zebr…

Author profile picture

Ross Martin

Insurance Writer

Credentials
  • 4+ years in the Insurance Industry

Ross joined The Zebra as a writer and researcher in 2019. He specializes in writing insurance content to help shoppers make informed decisions.

Ross h…

Protect your car from that pothole: compare insurance quotes today.

Location pin icon
No junk mail. No spam calls. Free quotes.

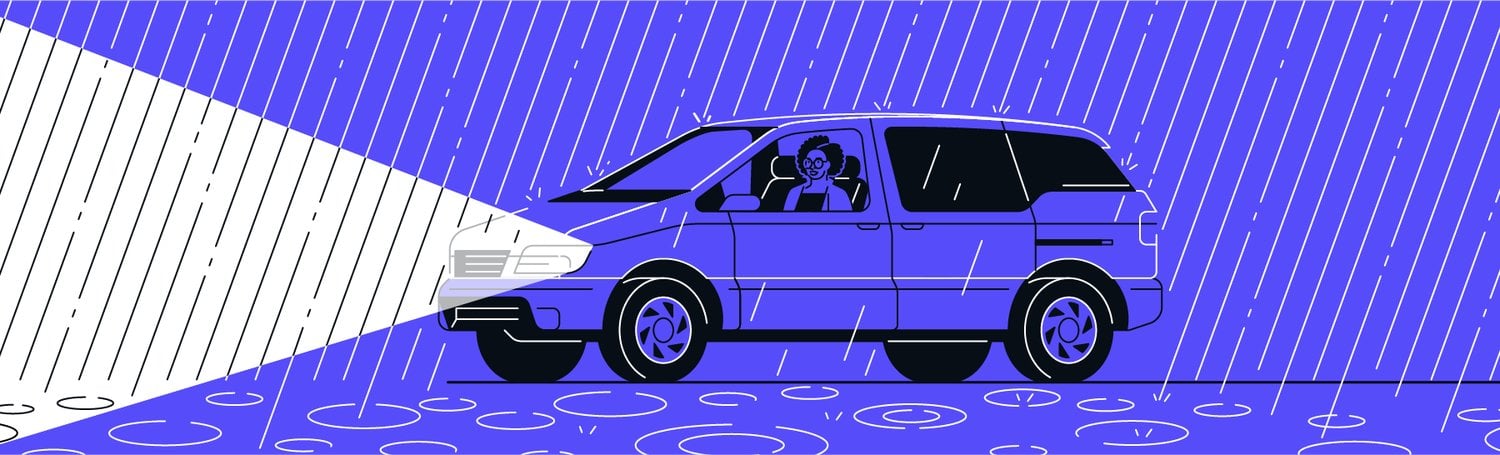
There's nothing like taking to the open road on a cloudless day, the path clear before you for miles. But then there are the other days. Hail, rain, fog, snow, potholes. These things can lead to poor visibilty, dangerous driving conditions and an increase in traffic accidents. Drivers living in different areas of the country can be affected by different adverse driving conditions due to everything from poor infrastructure to weather. And the amount they pay for insurance reflects that (along with othe rating factors). 

We recently looked at a number of factors to find the worst cities for driving conditions in the U.S. We evaluated the top 50 metropolitan areas based on population. We then ranked them based on five categories that have a significant impact on road conditions. 

  • Road quality (by state)
  • Annual days of fog (by city)
  • Annual days of rain (by city)
  • Total inches of snow each year (by city)
  • Number of hail claims (by state)

Before you set out for any road trips, take a look at our top 10 worst cities for driving conditions based on these seven criteria. How does your city stack up?

#1: Buffalo, New York

Buffalo is known for its snowy weather, so it’s not surprising that this factored into its having some of the worst driving conditions of any of the cities we looked at. Buffalo averages over 95 inches of snow per year, which can impact both visibility and road condition. Also affecting visibility is Buffalo’s frequent fog. Additionally, New York State residents had a low opinion of the road infrastructure, rating them on average 5.8/10.

Buffalo by the numbers

  • Percentage of roads with poor pavement in New York cities: 30%
  • Annual days of fog: 174
  • Annual days of precipitation: 166
  • Total inches of snow each year: 95.8

#2: Providence, Rhode Island

While plagued by a bit less snow, Providence driving conditions are only slightly better than in Buffalo. For starters, Rhode Island residents are not fans of their infrastructure, rating them 6.5/10, and the American Society of Civil Engineers gave the Rhode Island roads a C-minus[1]. In addition to having the lowest ranking for road quality on our list, Providence also experiences its share of fog, rain and snow.

Providence by the numbers

  • Percentage of roads with poor pavement in Rhode Island cities: 42%
  • Annual days of fog: 166
  • Annual days of precipitation: 127
  • Total inches of snow each year: 36.6

#2: Pittsburgh, Pennsylvania

Pittsburgh is tied with Providence for the city with the second worst driving conditions. Pennsylvania only ranks in the middle for road quality. But the city regularly experiences precipitation, snow and fog. 

Pittsburgh by the numbers

  • Percentage of roads with poor pavement in Pennsylvania cities: 21%
  • Annual days of fog: 183
  • Annual days of precipitation: 154
  • Total inches of snow each year: 44.1

#4: Milwaukee, Wisconsin

Coming in fourth for worst driving conditions, Milwaukee again has its share of Midwestern weather, influenced by nearby Lake Michigan. Fog, snow and rain all affect the conditions on the city’s roads. Wisconsin as a whole also has the third worst maintained roads of any state.

Milwaukee by the numbers

  • Percentage of roads with poor pavement in Wisconsin cities: 29%
  • Annual days of fog: 142
  • Annual days of precipitation: 125
  • Total inches of snow each year: 48.7

#4: Detroit, Michigan

Starting off, Detroit’s roads aren’t in great condition, and Michigan residents rating them a 3.9/10. The roads received a D rating by the American Society of Civil Engineers[2]. Difficult driving in the city is compounded by plenty of precipitation throughout the year. Detroit ranks in the lower half of states for snow, rain and fog.

Detroit by the numbers

  • Percentage of roads with poor pavement in Michigan cities: 25%
  • Annual days of fog: 156
  • Annual days of precipitation: 136
  • Total inches of snow each year: 45

#4: Boston, Massachusetts

Leaving the Midwest, Boston is tied with Milwaukee and Detroit for fourth. Massachusetts has the fifth worst roads in the country with residents blaming harsh winters and road salt, along with poor maintenance for the plentiful potholes. An abundance of snow also doesn't help the overal driving conditions. 

Boston by the numbers

  • Percentage of roads with poor pavement in Massachusetts cities: 31%
  • Annual days of fog: 139
  • Annual days of precipitation: 128
  • Total inches of snow each year: 49.2

#7: Hartford, Connecticut

Just 100 miles away is Boston’s neighbor to the southwest: Hartford, Connecticut. The driving conditions here are made worse by the usual trio of frequent fog, snow and general precipitation. Connecticut’s roads themselves aren’t as bad, but the state still ranks in the bottom half of states for overall road quality.

Hartford by the numbers

  • Percentage of roads with poor pavement in Connecticut cities: 15%
  • Annual days of fog: 162
  • Annual days of precipitation: 129
  • Total inches of snow each year: 51.7

#7: Cleveland, Ohio

Cleveland ranks above average for snow and precipitation and is right in the middle in terms of fog. Ohio’s roads are also right in the middle in terms of overall road quality.

Cleveland by the numbers

  • Percentage of roads with poor pavement in Ohio cities: 17%
  • Annual days of fog: 157
  • Annual days of precipitation: 159
  • Total inches of snow each year: 63.8

#9: Seattle, Washington

Seattle is our only West Coast city to make the list, thanks to its above average fog and precipitation. The amount of snow and hail is thankfully low. Washington roads aren’t the best but they nearly escape the top 10 worst roads in the country, coming in at number 11. Residents of the state rank their roads a 5.8/10.

Seattle by the numbers

  • Percentage of roads with poor pavement in Washington cities: 23%
  • Annual days of fog: 165
  • Annual days of precipitation: 156
  • Total inches of snow each year: 6.3

#9: Columbus, Ohio

Returning yet again to the Midwest, Columbus ties with Seattle for number 9. It has less rain but more snow (though way less than Cleveland). As mentioned above, Ohio roads are middle of the pack.  

Columbus by the numbers

  • Percentage of roads with poor pavement in Ohio cities: 17%
  • Annual days of fog: 166
  • Annual days of precipitation: 141
  • Total inches of snow each year: 28.2

Staying safe while on the road depends on both the skill of the driver and the environment in which they’re driving. Regardless of where you're driving, it’s smart to stay aware of what weather is most likely to impact your city’s road conditions and how to best prepare for inclement days.

Methodology

The Zebra pulled five data points to analyze the top 50 MSAs (by population) in the U.S. for:

MSA data was used where applicable, and we sometimes substituted city or state data as necessary.